In the five years since natural gas production began to take off in Appalachia, volumes in the Marcellus and Utica basins have increased by a factor of 9X. Much of that natural gas production growth is “wet” gas containing significant volumes of NGLs. Consequently NGL production volumes have skyrocketed and midstream development has been booming. But building all this midstream infrastructure in Appalachia does not work the way it does in other high-growth shale plays. Making sense out of Marcellus/Utica midstream infrastructure is the subject of RBN Energy’s latest Drill Down report, “Join Together With Demand--The Who and How of Marcellus/Utica Midstream”. In today’s blog, we provide highlights of the report and discuss what’s in store for the Marcellus/Utica over the next couple of years using our new Pipeline GIS mapping system to help tie all of the assets together.
They say that necessity is the mother of invention, and that proverb has certainly proved itself in the Shale Era. Examples abound. Building new rail-loading terminals to move stranded Bakken crude to market. Reversing the direction of major natural gas pipelines. Re-plumbing much of the Gulf Coast to reflect changing sources of crude oil. And our topic today, innovative approaches to meet the unique challenges of Marcellus/Utica midstream.
In the Drill Down report we release today, we examine in detail all that has been done—and is being done still—to support the very rapid expansion of gas and NGL production in the Marcellus/Utica. Over the past five years, the Upper Ohio River Valley has been transformed from an energy backwater to a production leader, both for natural gas and NGLs.
Consider the astronomical growth of NGL volumes in the region. The graphs below (Figure #1) show daily output of NGLs based on processing plant data from the EIA Petroleum Administration for Defense District 1 (PADD 1), which covers most of the Marcellus/Utica region except for Ohio (which is in PADD 2). Over the 2006-14 period, annual average NGL production increased from 22 Mb/d to 191 Mb/d, with most of that increase occurring in the past two years. By January 2015 production was up to 234 Mb/d. The graphs show production growth for the individual purity products over the period. Propane (blue line) increased from about 10 Mb/d in 2006 to about 30 Mb/d in 2012 and has leapt to 104 Mb/d since then. Liquid ethane production (gold line) was essentially non-existent before 2014 because until then there was no take-away transportation available. Ethane was “rejected” into the pipeline natural gas system and sold as natural gas. In the past 14 months, ethane production (now moved by pipeline to the Gulf Coast or exported to Canada, also by pipe) jumped to 76 Mb/d in December 2014 before falling back to 57 Bcf/d in January 2015 due to operational issues.
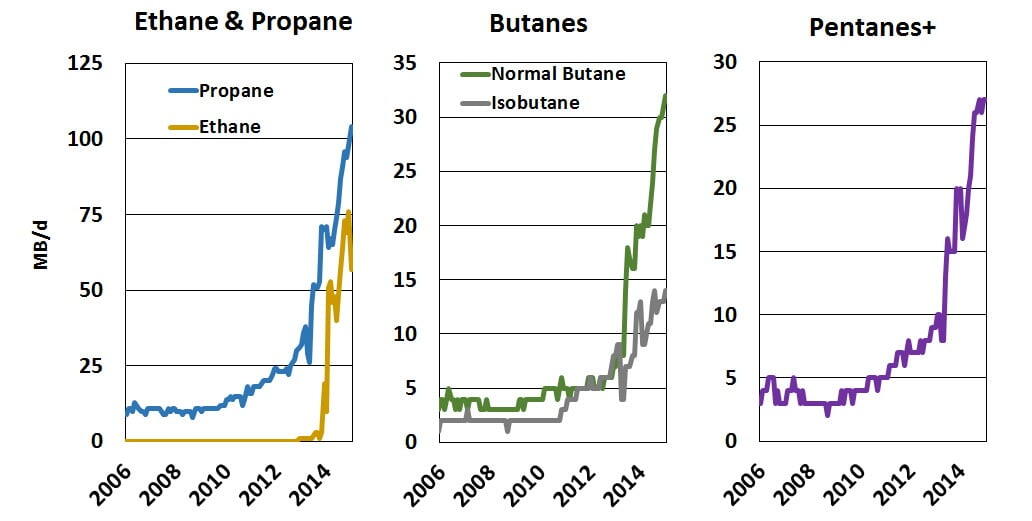
Figure #1 – Daily Output of NGLs from PADD 1; Source: EIA
The middle graph shows the sharp increases in regional production of normal butane (green line) and isobutane (grey line). Normal butane production soared to 32 Mb/d by January 2015, and isobutane rose from 1 or 2 Mb/d before 2010 to the mid-teens in January 2015. The graph to the right shows the increase in pentanes plus (purple line), also known as natural gasoline or C5+, which is the heaviest NGL. Pentanes-plus production was less than 5 Mb/d before 2010 but doubled to 10 Mb/d in 2013 and more than doubled again to 27 Mb/d by January 2015.
While the rolling hills of southwestern Pennsylvania, northern West Virginia and eastern Ohio for many decades have been crisscrossed by several major gas pipelines, the region had next-to-none of the infrastructure needed to wring all of these NGLs from wet gas, fractionate those liquids into the five “purity” products and move the NGLs to market. The new Drill Down report catalogues the key midstream assets in the Marcellus/Utica, describes how these assets work together to meet the needs of regional players and explains how planned infrastructure will continue to enable growth in both natural gas and NGL production in the region. Some of the findings of our report are summarized below.

About the song
“Join Together” was written by Pete Townshend. The song was originally intended to be a part of The Who’s Lifehouse project, an unfinished science fiction rock opera that Pete Townshend was writing as a follow-up to Tommy. Recorded at Olympic Studios in London in May 1972, “Join Together” was released as a single in June 1972. Produced by The Who with Glyn Johns, it went to #17 on the Billboard Hot 100 Singles chart. The song has been included in several Who compilation albums, beginning with the Hooligans double hits album released in September 1981. Personnel on the record were: Roger Daltry (lead vocals, harmonica), Pete Townshend (guitar, synthesizer, Jew's harp, backing vocals), John Entwistle (bass, backing vocals), and Keith Moon (drums).
Hooligans is a double compilation record of hits from The Who running from 1964 to 1978. Released in September 1981, the LP went to #52 on the Billboard 200 Albums chart and has been certified Gold by the Recording Industry Association of America.
The Who are an English rock band formed in London in 1964. Its core lineup was Roger Daltry on lead vocals, Pete Townshend on guitar, John Entwistle on bass, and Keith Moon on drums. They are considered by many to be one of the most influential rock bands of the 20th century. They have released 12 studio albums, 16 live albums, four soundtrack albums, 27 compilation albums, four EPs and 58 singles and have sold over 100 million records worldwide. The Who are members of the Rock and Roll Hall of Fame and UK Music Hall of Fame, and are the recipients of a Lifetime Achievement Award from the Grammy Foundation. Roger Daltry and Pete Townshend received Kennedy Center Honors as members of The Who in 2008. Daltry and Townshend have both released solo albums over the years, and both continue to record and tour as The Who. The Who are currently on the road with The Who Hits Back! tour in the UK.