US natural gas liquids (NGL) production is growing fast, and surplus volumes are moving to export markets. NGL production from natural gas processors increased from 1.7 MMb/d in early 2009 to 3.0 MMb/d this year (2014), and it is expected to continue growing to 4.5 MMb/d by 2019. Despite the important role of NGLs, these markets are not well understood, both due to their complexity and the unique aspects of their production, transportation, storage and use. One of the most misunderstood aspects of NGL markets – the extraction of NGLs from natural gas, is the subject of RBN’s latest Drill-Down Report. In today’s blog we’ll look at highlights of the report which reviews the basics of natural gas processing, current NGL markets, an outlook for NGL production, the health of NGL processing as measured by the Frac Spread, and a detailed review of RBN’s gas processing economics model.
As production of the five NGLs – ethane, propane, normal butane, isobutane and natural gasoline - continues to ramp up at a blistering pace, an oversupply of NGLs has put downward pressure on prices. But even though prices are lower relative to their peak levels in 2011, the value of NGLs remains more than twice the price of natural gas on a per-BTU basis. As a result, producers have continued to focus much of their natural gas drilling activities on wetter, higher-NGL content shale plays. In addition, the ramp-up of U.S. crude oil production since 2011 has brought with it associated gas that tends to have a high NGL content, further increasing NGL volumes.
With these market changes, NGL production already exceeds U.S. demand, and that gap between supply and demand is increasing. In recent months almost 50% of gas plant production of propane has been exported, mostly to overseas markets. It is a similar story for natural gasoline, with almost half of that NGL product exported, primarily to Canada for use as a diluent – blended with heavy crude so that it can be moved via pipeline. And natural gas processors can now make far more ethane - the largest component of the NGL barrel - than the U.S. petrochemical industry can consume, leaving two primary options for excess supplies: rejecting ethane into the natural gas stream or exporting ethane. In 2014, about 330 Mb/d of ethane—approximately 20% of what could otherwise be produced--is being rejected – sold as natural gas at BTU value rather than produced as liquid ethane and used as a petrochemical feedstock.
But even with widespread rejection of ethane, total NGL production is still growing rapidly, and an NGL infrastructure building boom is underway to handle all of the supply. During the 2013-15 period, more than 70 new gas processing plants already have or will come online, adding nearly 15 Bcf/d of new processing capacity. As these assets are completed and new NGL production flows into the market, the consequences for each NGL product are different, depending on demand and disposition alternatives. It is clear, however, that the U.S. can—and will continue to—produce more NGLs than it can consume, and a significant share of NGLs will find its way overseas.
Natural gas and crude oil markets are complicated enough, but NGL markets – really five markets tied together by a common source of supply, can seem even more convoluted. A thorough understanding of NGL markets must start with that common source of supply for most NGLs – the natural gas processing plant. But unfortunately the inner workings and economics of gas processing can appear equally byzantine if you go at it looking at engineering texts, or worse yet, getting a technical explanation from a chemical engineer.
Fortunately the fundamentals of natural gas processing can be grasped by non-engineers when their intricacies are presented in a step-by-step, rational manner. Making gas processing economics understandable to the non-geeks among us is the aim of RBN Energy’s latest “Drill-down” report titled Tailgate Blues.
This RBN report is intended to provide that understanding of the dynamics of natural gas processing --when NGLs must be extracted to meet pipeline standards, when it makes economic sense to extract NGLs, what drives ethane rejection, and a myriad of related issues. The report investigates natural gas processing economics in the context of recent developments in NGL markets. It begins with the fundamentals of each NGL market, including physical characteristics, transportation considerations and end-uses. It then explores the natural gas processing industry, covering the composition of NGLs in natural gas, natural gas processing plants and fractionation centers, and the current production outlook for each of the NGL products over the next five years. The remainder of the report examines the process of separating NGLs from the raw gas stream, the “Frac Spread” (a common measure of the health of natural gas processing economics), and then concludes with the detailed RBN model we developed for assessing and understanding natural gas processing economics. Both the RBN Frac Spread Model and processing economics model are included as downloads.
The Basics of Natural Gas Processing Economics
While NGLs are often lumped together as, well, NGLs, each one has its own, unique molecular make-up (two carbon atoms in ethane – C2, three in propane – C3, four in normal butane and isobutane –NC4 and IC4, and five in pentane – C5, the main component of natural gasoline). Each NGL has its own BTU content (more carbon atoms means higher BTU), and its own end-uses. About 80% of U.S. NGL production is from natural gas processing plants. The other 20%, mostly propane, comes from refineries. When raw gas emerges from a wellhead, it typically contains a mix of natural gas (also called methane or C1); “impurities” like water vapor, carbon dioxide, and hydrogen sulfide; and NGLs. Before natural gas can be fed into high-pressure, long-distance pipelines that transport the gas to market, it generally must be treated to remove impurities and processed to remove NGLs.
A gas processing plant is essentially a super-cooling refrigerator. It cools an inlet stream of raw gas to the point that the NGLs (C2 through C5+) condense into a liquid but the lighter methane (C1) remains a gas. The outlet stream of natural gas—also known as residue or tailgate gas (the inspiration for our title, “Tailgate Blues”) --moves to a natural gas pipeline for transportation to market. Thus the key economic relationship for gas processors is the difference between the price of natural gas and the price of NGLs. When NGLs are removed from natural gas, there is less natural gas left to sell. But since NGLs are usually worth two to three times the value of natural gas that is not a problem. Effectively extraction of the NGL portion of the natural gas stream is a significant upgrade in value of the molecules, and that upgrade in value is the economic uplift provided by the natural gas processor.
Natural gas processing does not produce the five individual NGL products. Instead the NGL output from a gas processing plant contains all of the NGLs mixed together in a stream called “y-grade” (or, sometimes, “raw make” or “raw mix”)--then moved via pipeline, rail tank car, barge or truck for further processing before being delivered to market. The processing step between extraction of mixed NGLs at a gas processing plant and the delivery of “purity” products to market is called fractionation. A fractionator separates the mixed, y-grade NGL stream into the five individual NGL products.
The Frac Spread
A simple way often used to calculate that key relationship between the price of natural gas and the price of NGLs is the Frac Spread (“Frac” being short for fractionation and the “spread” being the difference between the natural gas price and the weighted average price of the five NGLs). There are several ways to calculate the Frac Spread, but the most basic involves measuring the difference between the price of natural gas and the weighted average price of NGLs on a per-BTU basis.
The graph below in Figure 1 shows the Frac Spread (blue line) calculated in this way since January 2007. The average Frac Spread since then has been about $7.50/MMbtu (red line). In the 2007-2008 timeframe, the Frac Spread ramped up to $10-12/MMbtu for a short time due primarily to the influence of crude oil prices that pulled up NGL prices dramatically. Then in 2009, NGL prices crashed along with crude oil (and most other commodities) with the economic meltdown. In 2009, the Frac Spread began a relentless move upward as crude oil prices recovered pulling NGL prices with them, while natural gas prices succumbed to oversupply surpluses and dropped precipitously. That was good news for the Frac Spread. From early 2011 through midyear 2012, the Frac Spread enjoyed a Golden Age with very low gas prices and very high NGL prices. (For more information see The Golden Age of Natural Gas Processors.)
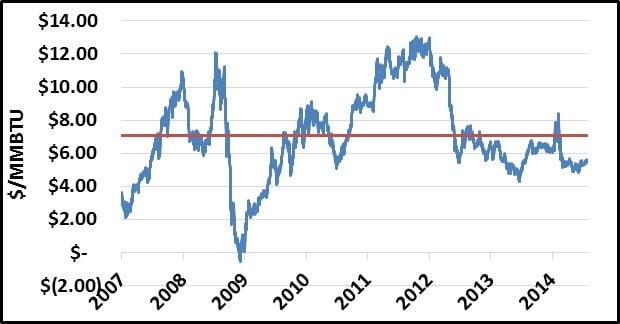
Figure #1
Source: OPIS and CME data from Morningstar (Click to Enlarge)
It was that Golden Age that encouraged a huge shift of drilling activity from dry gas plays to wet gas plays containing more NGLs. As NGL production increased, NGL prices fell, particularly the prices for ethane and propane, together making up more than two-thirds of the NGL barrel. Those lower NGL prices were primarily responsible for a decline in the Frac Spread below $5.00/MMbtu in mid-2013. Since 2012, the Frac Spread has remained fairly stable at about $6.00/MMbtu where it remains today. At this level it is certainly well below the Golden Age, but only $1.50/MMbtu below the eight year average of $7.50/MMbtu and is still high enough to encourage producers to target rich gas, high in NGL content. [You can see the Frac Spread calculated every day on our website in the Spotcheck section.]
Calculation of the Frac Spread as shown in Figure #1 is quite simple. Recall that each NGL has a different BTU content, with ethane (C2) having the lowest and natural gasoline (which is primarily pentane, or C5) having the highest. The Frac Spread model (available for download with the Drill-Down Report) uses the BTU factors for each NGL to convert NGL prices per gallon (using OPIS Mont Belvieu prices) into their BTU equivalents. We then weight average the BTU equivalent NGL prices based on the mix of NGLs in a typical NGL barrel. Finally that resulting price is compared to the price of natural gas (using the CME/NYMEX front month futures price), also on a BTU basis. Note that the mix of NGLs in any given NGL stream can vary widely, not just among shale plays and gas fields but also among the wells within a gas field. That is one shortcoming of the Frac Spread as a representative measure of processing margin. The other is that the Frac Spread as shown above does not take into account a whole range of plant specific considerations, such as the extraction efficiency of the plant, the BTU content of the inlet gas stream or transportation/fractionation costs that impact plant prices.
The RBN Processing Economics Model
A model developed by RBN Energy called MQQV provides a much more exact set of calculations for assessing a specific raw gas stream and for calculating the revenues generated by extracting NGLs from raw gas with a specific set of characteristics. The model also assists in determining whether ethane rejection would be beneficial to a particular processing plant’s bottom line. Think of MQQV (for Measurement, Quantity, Quality and Value) as chess to the Frac Spread’s checkers. Or, if you are reading this over breakfast, think of our model as crispy bacon, scramble eggs and a buttered English muffin, and the Frac Spread as a cold Pop Tart!
Gas processing economics is founded on basic knowledge about the conversion of hydrocarbons from one state to another--gas to liquid, and liquid to gas--and about how much energy (that is, how many BTUs) a given amount of liquid or gas contains. NGLs enter a gas processing plant as a raw gas stream, and are extracted from the gas and converted to liquids. They exit the plant as liquids and then are sold in liquids units--gallons or barrels. At every stage in the process, the gases or liquids have a measurable energy content. In the report, we take you through, step-by-step, beginning with the conversion of the gaseous NGLs in a particular raw gas stream (with its chemically specific, percent-based mix of ethane, propane etc.) into liquid NGLs. Then we factor in a specific plant’s processing capacity and its efficiency in removing ethane and the other NGLs, and then plug in natural gas and NGL prices to calculate a useful estimate of the economic uplift provided by removing all five NGLs—or, as an alternative, the uplift (often greater, in today’s market) of rejecting the ethane into the gas. Our MQQV model (available for download with the Drill-Down Report) is not simplistic, but it is relatively simple to understand, and—like that good breakfast we described—satisfying. There is real value to gaining a solid understanding of natural gas processing economics, and this is the best tool we have come across yet to accomplishing that.
About the song
Tailgate Blues by Luke Brian is the title track from the album Tailgates and Tanlines released on August 9, 2011. See, we really do listen to music other than golden oldies.