Even though ethane prices have recovered by about 4 cnts/gal from the lows last week (January 14, 2013) most gas processing plants are still faced with ethane rejection economics. The past two blogs in our Gas Processing Economics series examined the impact of ethane rejection for a specific plant configuration, running a range of Eagle Ford gas streams. But Eagle Ford gas is quite rich and high in ethane content – certainly not representative of the overall market. Is it possible to use the RBN Gas Processing model to look at the aggregate market for U.S. gas processing? That answer is yes, if you don’t mind hacking your way through some EIA statistics and manipulating a few input variables.
Background
This blog continues where we left off in Tailgate Blues – Gas Processing Economics – Part 5. There we incorporated prices into the RBN Gas Processing model and showed the economic impact of ethane rejection on three different Eagle Ford gas streams. Earlier in the series we looked at the calculation of the residue gas stream (Part 4,) and the inlet gas stream and NGL output (Part 3).
As always with these gas processing blogs, we need to warn you that: (a) this is a deep dive, not a casual read; (b) it will be difficult if not impossible to follow today’s discussion without having read the earlier parts of the Gas Processing series.
Hacking the Gas Processing Model
Since this is a hack, by definition we are not aiming for precision. Instead we are trying to understand the general relationships between the numbers. A hundred refinements would be needed to make this a real model of U.S. gas processing. Also be aware that we are going through this hack using 2011 EIA numbers – for two reasons. First, because some of the numbers we need for this exercise have not been updated for 2012. Second, because the EIA monthly data only runs through October 2012. We will come back in a later blog to look at the trends in the EIA numbers and make an educated guess for all of 2012. In the meantime we’ll go through the model using 2011 data.
The number’s we’ll use are lower-48 gas and NGL statistics. That means looking at total U.S. numbers less Alaska. To get meaningful numbers we need to take Alaska out of the equation because they have a lot of gas production but re-inject most of it for enhanced crude recovery, yielding only small volumes of NGL production. Basically we want to know how much natural gas produced in the lower-48 was processed to produce NGLs and the NGL volumes that were produced as a result.
In the next paragraph we’ll tell you where the numbers for our hack model come from and how to find them on the EIA website. You’ll have to do some number hunting to follow this, but we’ll provide the links to the EIA pages where all the numbers we reference can be found.
First we need an estimate of how much dry gas production was processed to extract natural gas liquids. The numbers come from EIA’s Natural Gas Plant Processing data on the Natural Gas side of EIA’s website. Look for annual data by data series for the whole US and annual data by area for Alaska – the natural gas numbers are quoted in MMcf/year and we convert to Bcf/d (divide by 365,000). The lower-48 dry gas production processed in 2011 was 37.933 Bcf/d (after removing 7.46 Bcf/d from Alaska). This number will be the inlet volume in our hack model gas plant.
Next we need the Total Liquids Extracted or NGL production for 2011. This data is quoted in Mb/year so divide by 365 to get Mb/d). The US total in 2011 was 2,216 Mb/d, less 50 Mb/d for Alaska yields 2,166 Mb/d. We use this number as our estimate of total liquids production in our hack model gas plant.
The last dataset we need are the percentages of individual NGLs produced. We get these numbers by simply dividing the total US production of each purity product in the EIA tables by all the total NGLs produced to give us a product yield percentage. The data comes from the crude oil and processing side of EIA’s data, Natural Gas Plant Field Production. The percentages of each NGL product for 2011 from this data are: ethane – 42%, propane – 28%, normal butane – 7%, isobutane – 10%, natural gasoline – 13%. There are some quirks about the split between isobutane and normal butane that we have discussed in previous blogs but will not get into here. After all, this is just a hack. We will use these percentages to estimate the purity products production in our hack model gas plant.
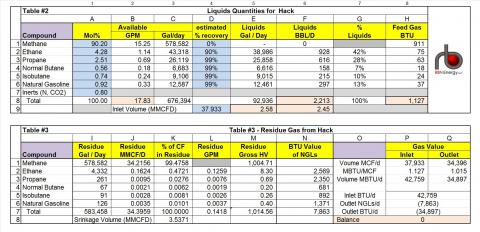
In the interest of time and space, we will not go through all the details of our hack calculation. Instead we’ll just show where the inputs come from, and what the calculations tell us about ethane rejection. Tables#2 and #3 from our hack spreadsheet are shown below.
For Table #1 and to see the calculations you’ll need to download the spreadsheet at the link found at the bottom of this blog. If you have trouble with the download, please email info@rbnenergy.com and we’ll send you a copy.
(Click to Enlarge)
We replace the plant inlet volume in Cell D9 in Table #2 with total lower-48 gas processed in Bcf/d, or 37.933 Bcf/d. [The model labels assume the data is MMcf/d but to handle the “national” case we need to round up to Bcf/d and everything else in the model gets multiplied by 1000.]
Then things get tricky. We know the target % Liquids in Table #2 Column (G) that we calculated a minute ago from the EIA data and we know the target total NGL volume that the “national” plant should produce. We don’t know the Mole % values for the “national” inlet gas stream. Getting to the Mole % numbers requires solving (either iteratively or using Excel Solver) the values by iterating numbers based on our target % liquids and target NGL volume.
[Note that we did not change our recovery percentages in the model in Table #2, Column (D), even though these numbers are representative of a relatively sophisticated cryogenic plant, not the ‘average’ plant in the U.S. fleet. However because we are solving the mole % values based on the actual total NGL production and the actual liquids percentages, the estimated recovery % numbers are not as important in this exercise.]
The results of our solver calculations are in Table#2 above. We ended up with the % Liquids values in Table #2 Column (G) staying true to our target and the Total Liquids number in Table #2 Cell (F8) being 2213 Mb/d instead of our target of 2166 Mb/d based on the estimated mole % values in Table #2 Column (A). All-in-all – pretty close. The other values in Table #2 and Table #3 are calculated by the model based on the inputs – including our “solved” mole percentages.
We can also do a couple of sanity checks on our hack model results. The first sanity check is on the GPM of the inlet gas in our model versus the EIA data. The model says 2.45 in Table #2 Cell F9. If we take the EIA actual total volume of NGL production of 2,166 Mb/d times 42 gallons per barrel and divide the result by the total volume of gas processed of 37.933 Bcf/d (need to multiply that by 1,000 to get the units right), that yields a GPM of 2.4. That check tells us the model GPM is pretty close to the actual value.
The second sanity check is on the shrinkage volume in Table #3 Cell (K8). That number is the equivalent of an EIA number called “Extraction Loss”. We can find that number in the EIA Natural Gas Gross Withdrawals and Production data table. If we take the 2011 Extraction Loss number for the whole US less Alaska then it works out at 3.0 Bcf/d. Our model calculates that shrinkage volume as 3.5 Bcf/d. But hey, this is a hack, so let’s not quibble about 0.5 Bcf/d for right now. There are a myriad of factors that could explain the difference.
Hacking Ethane Rejection with the Model
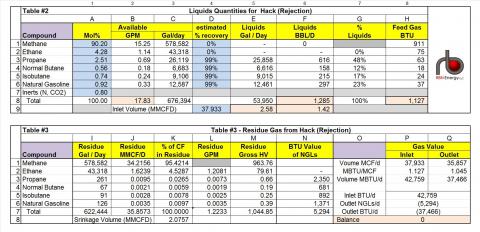
We can now easily work the most extreme (and unrealistic) ethane rejection scenario by zeroing out the ethane recovery percentage as shown in the tables below.
(Click to Enlarge)
When we do so, all 928 Mb/d of ethane disappears. Of course, this could never happen. There are all sorts of physical and contractual issues where many plants can’t reject ethane at all. We talked about some of those reasons in Rock Bottom - Zero netback for Conway Ethane in E-P. But if somehow all ethane was rejected, then we can see the impact on the shrinkage volume: 3.5 Bcf/d in the ethane recovery hack, 2.0 Bcf/d in the ethane rejection hack. Thus 100% ethane rejection would result in 1.5 Bcf/d of natural gas thrown back into the market. That number certainly makes sense in the context that total extraction loss is 3 Bcf/d. So if all of the ethane is rejected, then about 50% of the gas being processed is back in the market.
Practically speaking, nowhere near all of the ethane will ever be rejected. If we assume an extreme case of ethane rejection at 50% of total ethane production (use 45% as the estimated recovery percentage, since it is half of 90%), then ethane production drops to 464 Mb/d and the shrinkage volume increases to 2.8 Bcf/d. That would result in a 0.7 Bcf/d increase in natural gas into the market compared to the 90% ethane recovery hack model 3.5 Bcf/d shrinkage. That 0.7Bcf/d increase is the more likely gas market impact of massive ethane rejection. It’s not a trivial volume, but given today’s oversupply conditions not likely to have a massive market impact.
There are all sorts of other experiments you can do with this data that we haven’t time to get into here. In an upcoming blog we’ll look at some historical numbers and current gas processing capacity to see what it takes to estimate the actual percentage of ethane rejection, and whether certain regions are really in for a case of the Tailgate Blues.
Tailgate Blues by Luke Brian is the title track from the album Tailgates and Tanlines released on August 9, 2011. See, we listen to music other than golden oldies.
|
Each business day RBN Energy releases the Daily Energy Post covering some aspect of energy market dynamics. Receive the morning RBN Energy email by signing up for the RBN Energy Network. |


Comments
Ethane Rejection Economics
Hello Rusty,
Great write-up as always. Your ethane rejection scenario in this blog series describes a POP processing structure where the producer and processor are mutually incentivized to act economically with respect to ethane extraction. From the producer's perspective, do the ethane rejection/extraction economics change in a fee-based processing structure where a producer is paying a $/MMBtu processing fee on plant inlet volumes and receiving a 100% POP for residue gas and NGLs? Or is the ethane rejection/extraction decision still just based on the net MMBtu value of ethane vs resdiue gas at the plant? I didn't know if the $/MMBtu processing fee on plant inlet volumes in a fee based processing structure acted as a kind of sunk cost to the producer?