There’s already so much involved in developing new LNG export capacity: lining up offtakers, securing federal approvals, sourcing natural gas, developing pipelines ... the list goes on. Now, with the increased emphasis on minimizing emissions of methane, the folks involved in LNG exports are also wary of the methane intensity (MI) of their feedgas, which depends not only on the steps that gas producers, pipeline companies and LNG exporters themselves take to mitigate methane emissions but also on where the gas comes from. But with so many new export terminals coming online, gas flows are sure to change, right? So how can you possibly assess what those flow changes will mean for the MI of gas over time? In today’s RBN blog, we discuss the role that MI may play in sourcing natural gas for LNG.
To make an assessment of the MI of feedgas for the various terminals, now and in the future, we’ll be turning once again to the Arrow Model. As we said in the first blog in this series, RBN’s Arrow Model is a proprietary analytical framework that organizes Texas and Louisiana into pipeline “corridors” that can be used to assess changes in regional inflows and outflows via groups of pipes that serve similar markets from comparable supply sources. These pipeline corridors are aggregations of pipelines connecting relevant market hubs, some within Texas and Louisiana and others outside the two states. We also identified the LNG corridors through which gas exits the Gulf Coast. Among other things, we can use Arrow to decipher gas flows within a related group of individual corridors and how that will affect markets and basis over time.
Today, we’ll use it to help forecast the MI of natural gas flowing from production basins to destination markets. [This methodology could also be employed to look at other gas characteristics, like how contaminants, such as nitrogen or carbon dioxide (CO2), might flow between regions.]
The MI issue has been on our mind for a few years now, and for good reason. Both in the U.S. and abroad, many in the public and private sectors have been emphasizing the need to rein in methane emissions along the natural gas value chain. Three years ago, in Don’t Let Go, we pointed out the fact that methane, the primary component in natural gas, is the second-most-abundant GHG after CO2 and packs an extraordinary climate-warming punch, especially in the short term. The resulting push to minimize methane emissions has driven many U.S. gas producers to step up their efforts to detect and repair methane leaks, replace pneumatic equipment and take other steps to reduce the MI of their gas. (See our five-part Time Has Come Today blog series for more on certified/differentiated gas and our four-part Cover Me series on efforts to detect and reduce methane emissions.)
There’s more to all this than simply addressing climate concerns — there also are important regulatory and bottom-line reasons for gas producers, LNG exporters and others to minimize their methane emissions. For example, in December 2023 the U.S. Environmental Protection Agency (EPA) issued the final rule for methane emissions in the oil and gas industry, which (among other things) will require the phase-out of most routine flaring from oil wells; set new requirements for methane leak detection and repair (LDAR) at well sites, gas processing plants, compressor stations and other oil and gas facilities; and establish the Super Emitter Program, under which certain third parties can seek EPA authorization to use remote sensing technologies to detect super-emitter events at operators’ sites and report those events to the agency. The EPA rule will work in conjunction with the Methane Emissions Reduction Program (MERP) that was part of 2022’s Inflation Reduction Act (IRA). MERP’s defining element is a charge on excess methane emissions that EPA will begin collecting in 2025 (based on 2024 emissions data) from more than 2,000 large oil and gas systems. (The charge, which begins at $900/MT and ramps up over time, will only be levied on facilities that are out of compliance with EPA’s methane emissions requirements.)
[Separate but related, we’ve also covered issues surrounding the MI of natural gas used to produce clean hydrogen, which may well be a factor in determining whether such production qualifies for U.S. tax credits.]
For today’s discussion, we’re focusing in on the impact of MI in the LNG value chain. In November 2023 the European Union (EU) reached an agreement on a law that will set limits on the MI of LNG that is imported to its member states starting in 2030. Perhaps most importantly though, with recent guidance from the Department of Energy (DOE) surrounding their reasons for pausing LNG permits to non-FTA countries, it’s possible that DOE or the Federal Energy Regulatory Commission (FERC) may eventually consider the MI of the feedgas supplying a planned LNG export terminal when assessing permit applications.
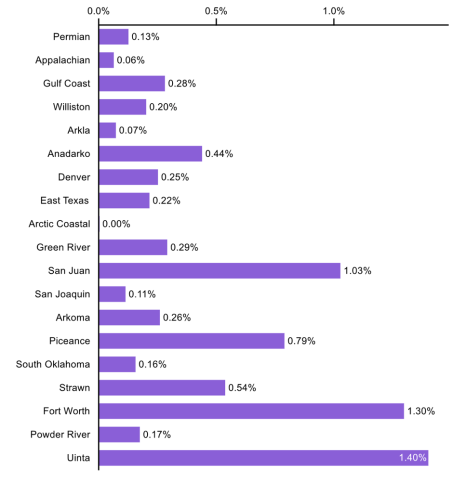
While the MI of natural gas from a particular basin, county, producer or group of wells is influenced to some degree by MI-reduction efforts such as LDAR and equipment-replacement programs, it is also determined by the very nature of the hydrocarbon resources being exploited — and how the natural gas there is produced. Figure 1 below, from Environmental Resources Management’s 2023 Methane Benchmarking Report, shows one recent estimate of the MI from natural gas produced in the U.S.’s 19 largest gas production areas — from the largest by produced volumes (the Permian Basin) at the top of the bar chart to the smallest (the Uinta Basin) at the bottom. As you can see, the estimated MI varies widely, from very low levels in the Permian and Appalachia to somewhat higher levels in the Gulf Coast (which includes the Eagle Ford) and Anadarko and much higher MIs in the San Juan Basin, the Fort Worth area and the Uinta.
Estimated Methane Intensity by U.S. Production Basin
Figure 1. Estimated Methane Intensity by U.S. Production Basin.
Source: Environmental Resources Management’s 2023 Methane Benchmarking Report
[It’s important to emphasize that these estimates only account for the methane that is measured and reported to the EPA under its Greenhouse Gas Reporting Program (GHGRP) and therefore do not include emissions from facilities below the program’s reporting threshold or emissions from sources not covered by the GHGRP. Still, they are a starting point, and provide at least an indication of how much MI can vary by basin.]
We need to emphasize that while the MI numbers in the Figure 1 chart might suggest that lower-MI production areas like the Permian and Appalachia would have a leg up on higher-MI basins when it comes to sourcing LNG feedgas, the rules and requirements around MI in LNG bound for Europe (and perhaps other major LNG destinations like Japan, South Korea and China) are very much a work in progress. For example, it remains to be seen how the EU will determine whether LNG bound for its member countries in 2030 and beyond meets its requirements. There are a lot of questions. Will, say, a certain grade of certified/differentiated gas qualify as “acceptable” LNG feedgas to an EU buyer? Will the low-MI gas in question need to be physically deliverable to the LNG terminal, or would a low-MI certificate of some sort — like a renewable energy credit (REC) for wind or solar power — be enough to at least partially satisfy the EU?
As a corollary, we noted in our recent series on the proposed rules for 45V, the production tax credit (PTC) for clean hydrogen, that there’s a big push to require that the renewable power used in the production of clean hydrogen is generated near the hydrogen production facility — a rule that’s generated a lot of frustration for low-carbon hydrogen developers who view the displacement of higher-intensity resources as a net benefit regardless of their physical location. Similarly, if the EU and other LNG buyers ultimately require a physical link between the low-MI gas production area and the LNG export terminal — and not just a certificate proving that a slug of low-MI gas was produced in a far-away basin — that could provide a real advantage to basins with naturally low MIs (especially those near Gulf Coast LNG export terminals) and a disadvantage to basins with naturally high ones.
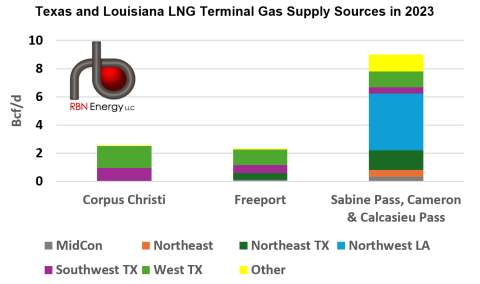
Which brings us to the Arrow Model and how it can be used regarding MI. We can estimate flows of natural gas from the producing basin, through the Arrow corridors, and to the LNG terminals now and in the future. The multicolored bars in Figure 2 below — based on the model — shows the sourcing of feedgas in 2023 (from left to right) for Corpus Christi LNG, Freeport LNG and a trio of LNG export terminals in Southwest Louisiana: Sabine Pass LNG, Cameron LNG and Calcasieu Pass LNG. As you can see, Corpus Christi sourced almost all its feedgas from West Texas (light-green bar segment) and the Eagle Ford (purple segment); Freeport relied on those same supply streams, but also pulled in gas from Northeast Texas (dark-green segment; mainly from Haynesville acreage on the west side of the Texas-Louisiana state line), and smaller volumes from the Midcontinent (very skinny gray segment) and elsewhere (very skinny yellow segment; including some from Appalachia). The Southwest Louisiana LNG terminals, in turn, had a gumbo-like mix of gas supply: Louisiana’s Haynesville (blue segment) made up half of the stream, but the Texas sources filling up Corpus Christi and Freeport also contributed a third of the total.
Figure 2. Sources of Supply for Selected LNG Terminals in 2023. Source: RBN
But those supply dynamics are sure to change. Over the next four years or so, a number of new LNG export facilities with combined gas demand of more than 8 Bcf/d are slated to come online in Texas alone, including Golden Pass LNG and Port Arthur LNG on the Texas side of the Texas-Louisiana border, an expansion at Corpus Christi LNG, and the greenfield Rio Grande LNG, each requiring incremental supplies of gas that will alter gas flows in both Texas and Louisiana.
Once these facilities ramp up, even the mighty combination of continued growth in the Permian and the Texas side of the Haynesville — plus gas from the Eagle Ford — will struggle to keep pace, leaving Texas with far less gas to send across the state line to LNG terminals in Louisiana. As a result, pipeline flows across the Sabine River from Texas into Louisiana are forecast to drop significantly. And, because Louisiana is still adding LNG export capacity with Plaquemines LNG and perhaps other new terminals, homegrown Haynesville supplies moving from Northwest Louisiana south to the mouth of the Sabine River will have to fill that gap and more. These new market dynamics mean that projects set to come online later this decade will consume a different mix of gas supplies than today’s terminals (referenced in Figure 2) — and that sourcing will impact the MI of feedgas for existing and planned LNG terminals alike.
The degree to which the MI of source gas for these terminals ultimately affects their commercial prospects is still up in the air. But the questions around feedgas, whether they pertain to supply adequacy, contaminants, or MI, are becoming more prominent. Now, regulators in the U.S. and abroad want to get a handle on how MI should be standardized and incorporated into emerging rules, such as the EU’s on the MI of LNG imports and, possibly, on federal permitting for new LNG export terminals. So understanding how these flow dynamics work is going to be an increasingly important consideration, and one we’ll be following closely as it evolves.
“Show Me the Way” was written by Peter Frampton and originally appeared as the second song on side one of Peter Frampton’s 1975 fourth studio album, Frampton. It gained massive popularity when it was released as the first single from Frampton’s double live album, Frampton Comes Alive! It appears as the third song on side one, record one of the double LP. Released in February 1976, it went to #6 on the Billboard Hot 100 Singles chart and has been certified Gold by the Recording Industry Association of America (RIAA). The song features a talk box, a unique guitar effect that allows you to “talk” through your guitar.) Personnel on the Frampton record were: Peter Frampton (lead vocals, lead guitar, talk box), Bob Mayo (rhythm guitar, keyboards, backing vocals), Stanley Sheldon (bass, backing vocals), and John Siomos (drums, percussion).
[Back in 1976, RBN’s managing director of musicology and another prominent member of the RBN team were members of Paradise, a popular cover band in Tulsa. The band snagged many high school prom gigs when they heard us play “Show Me the Way” authentically, complete with talk box. Personnel for Paradise were: Steve Hemmert (lead vocals, keyboards), Mickey McMahan (lead guitar, talk box, backing vocals), Rusty Braziel (bass, backing vocals), and Rick Hemmert (drums).]
Frampton Comes Alive! was recorded at four different venues in the U.S. between June and November 1975. It was the second double live album that Frampton was involved with, as he was a member of Humble Pie, whose Performance Rockin’ the Fillmore was released in November 1971 and went to #21 on the Billboard 200 Albums chart and was certified Gold by the RIAA. Produced by Frampton, Frampton Comes Alive! was released in January 1976 and went to #1 on the Billboard 200 Albums chart, where it remained for 10 weeks. It has been certified 8x Platinum by the RIAA. Three hit singles were released from the LP.
Peter Frampton is an English guitarist, vocalist, and songwriter from Kent, England. He started playing guitar in rock and roll bands at the age of 12. He joined the teen heart-throb band The Herd in 1966 — that band released five studio albums and 10 singles. He left The Herd in 1969 to form Humble Pie with Steve Marriott. He recorded four studio albums, one live album, and six singles while a member of Humble Pie. Frampton left the band for a solo career in 1971. As a solo artist, he has released 18 studio albums, four live albums, seven compilation albums, and 24 singles. He continues to record and tour and began his Never EVER Say Never Tour in March.


