Production forecasts for natural gas in the Appalachian Marcellus shale have doubled from 7 bcf/d to 14 bcf/d in less than two years. As a result northeast demand for natural gas will be almost entirely met from local production in coming years. Significant re-plumbing of the US natural gas pipeline distribution system will be needed and in many cases has already commenced. Today we review accelerating changes to US gas flows.
Last week several members of the RBN Energy team attended the best energy fundamentals conference in the business - Bentek’s annual Benposium in Houston. They covered all the North American energy markets in detail including updated forecasts of hydrocarbon production and the latest midstream infrastructure developments. Bentek also provide supply demand forecasts for crude, natural gas and natural gas liquids (NGLs).
Rusty gave the keynote presentation last Tuesday (May 14, 2013) titled “Why What We Thought We Knew About the North American Hydrocarbon Market No Longer Matters”. Despite the complicated title, it boiled down to a simple premise. If we look back to see what folk were forecasting for North American energy markets two years ago in 2011 and then compare that to today’s actual data and forecast, what would that tell us about the changing pace of North American energy production?
Looking at the data from Bentek – produced as always at the time in good faith based on what the market was telling them – we see that the scale of change going on in North American energy production exceeded everyone’s expectations. We looked at crude oil production forecasts in the Williston Basin and the Eagle Ford, the natural gas production forecast in the Marcellus and the US NGL production forecast from Bentek around the time of the June 2011 Benposium. What we found was that in every case – crude oil, natural gas and NGLs - today’s forecast numbers for what we expect by 2016 are at least double what they were back in 2011. In the first episode in this series (see Too Wrong for Too Long? – How 2011 Bakken Crude Forecasts Compare to Today) we looked at surging crude production in the Bakken. We learned how production surpassed earlier forecasts because rail transport options allowed producers to bypass the queue for pipeline takeaway capacity that might otherwise have slowed them down.
In this episode we look back at the Bentek 2011 outlook for natural gas production in the Marcellus by the end of 2015. Turns out that since then the production forecast has doubled and that is going to have dramatic consequences for traditional natural gas flows into the northeast in the coming years.
Back in 2011, Appalachia production had already grown from the 2 bcf/d of legacy volume, much of which had been there for nearly a hundred years to more than double that volume by the time of Benposium in June of that year. At that time the outlook was for the basin to grow another 3 Bcf/d by 2015 to total just over 7 Bcf/d (see Chart #1 below).
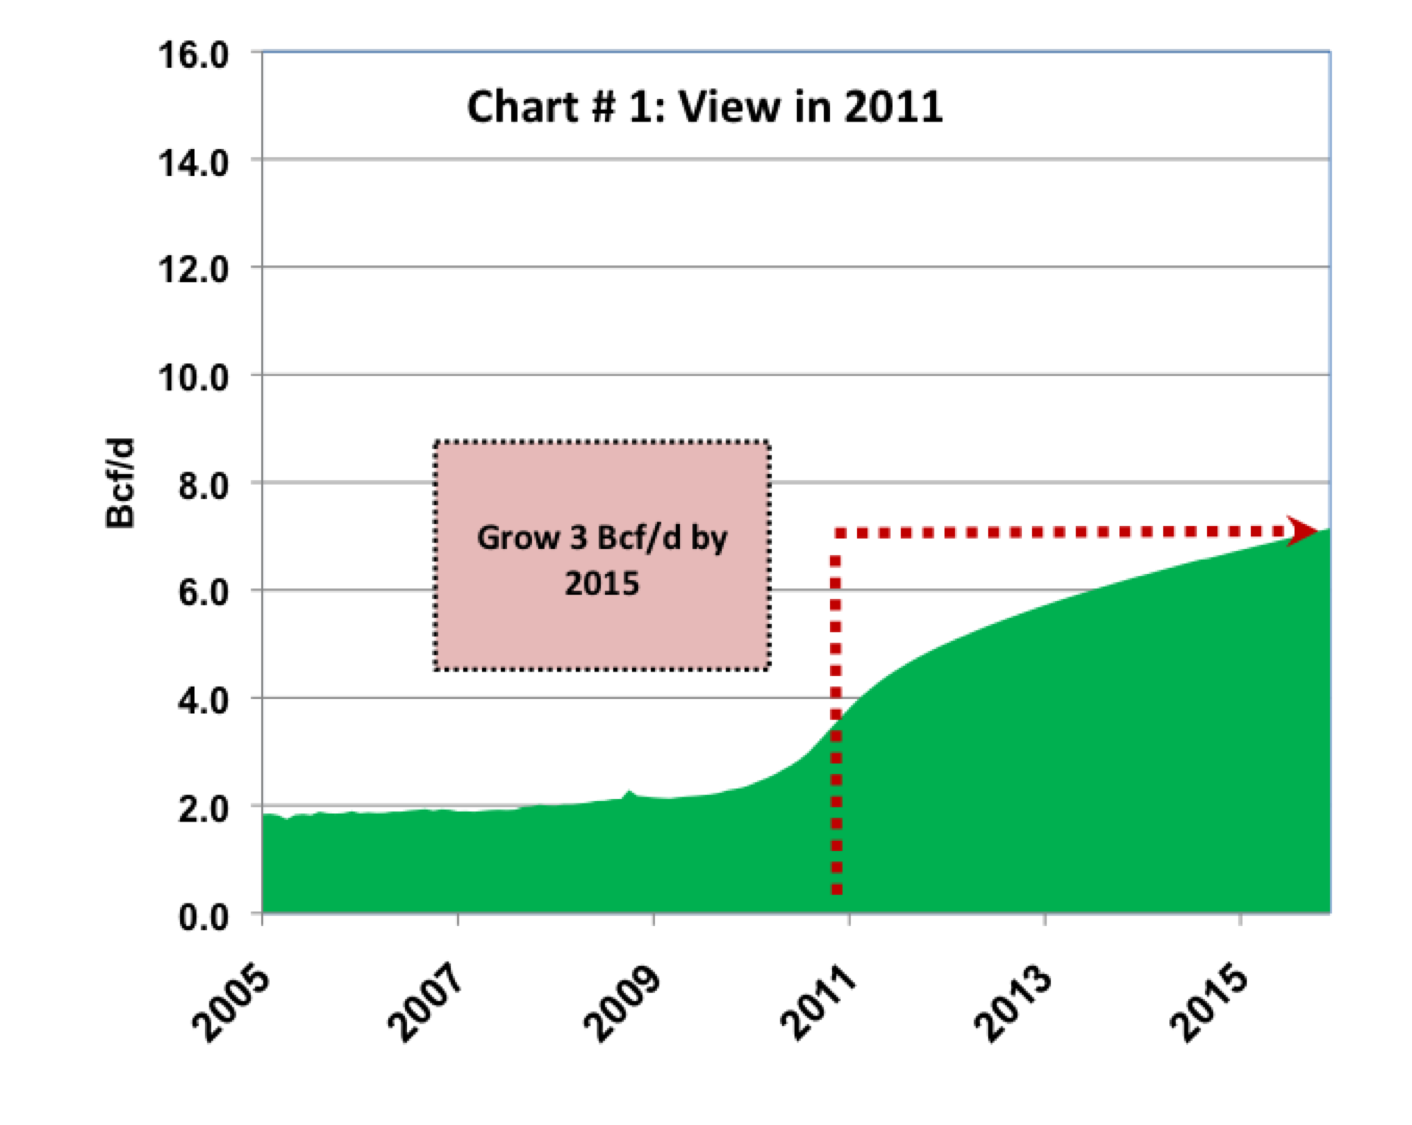
Source: RBN Presentation at Benposium 2013
Barely a year later in 2012 Marcellus production had blown past that 2011 outlook for 2015 and was headed to 10.5 Bcf/d today – the little star on Chart #2 below. Today in May 2012 the outlook for the Marcellus is for 14 Bcf/d by the end of 2015, almost double the projection of two years ago. Our theory on why Marcellus production grew so much faster than was expected is that the information available to the market was getting a haircut by the producers. That was likely because the natural gas industry got to hearing about the Marcellus at about the same time that it was already tired of hearing all the hype coming out of the Haynesville in Louisiana. Production in that basin had grown by a whopping 3 bcf/d between January 2010 and mid 2011 and would add another 1bcf/d by the end of 2011. So producers played it more conservatively and didn’t talk as if the Marcellus was going to change the world. But it will.
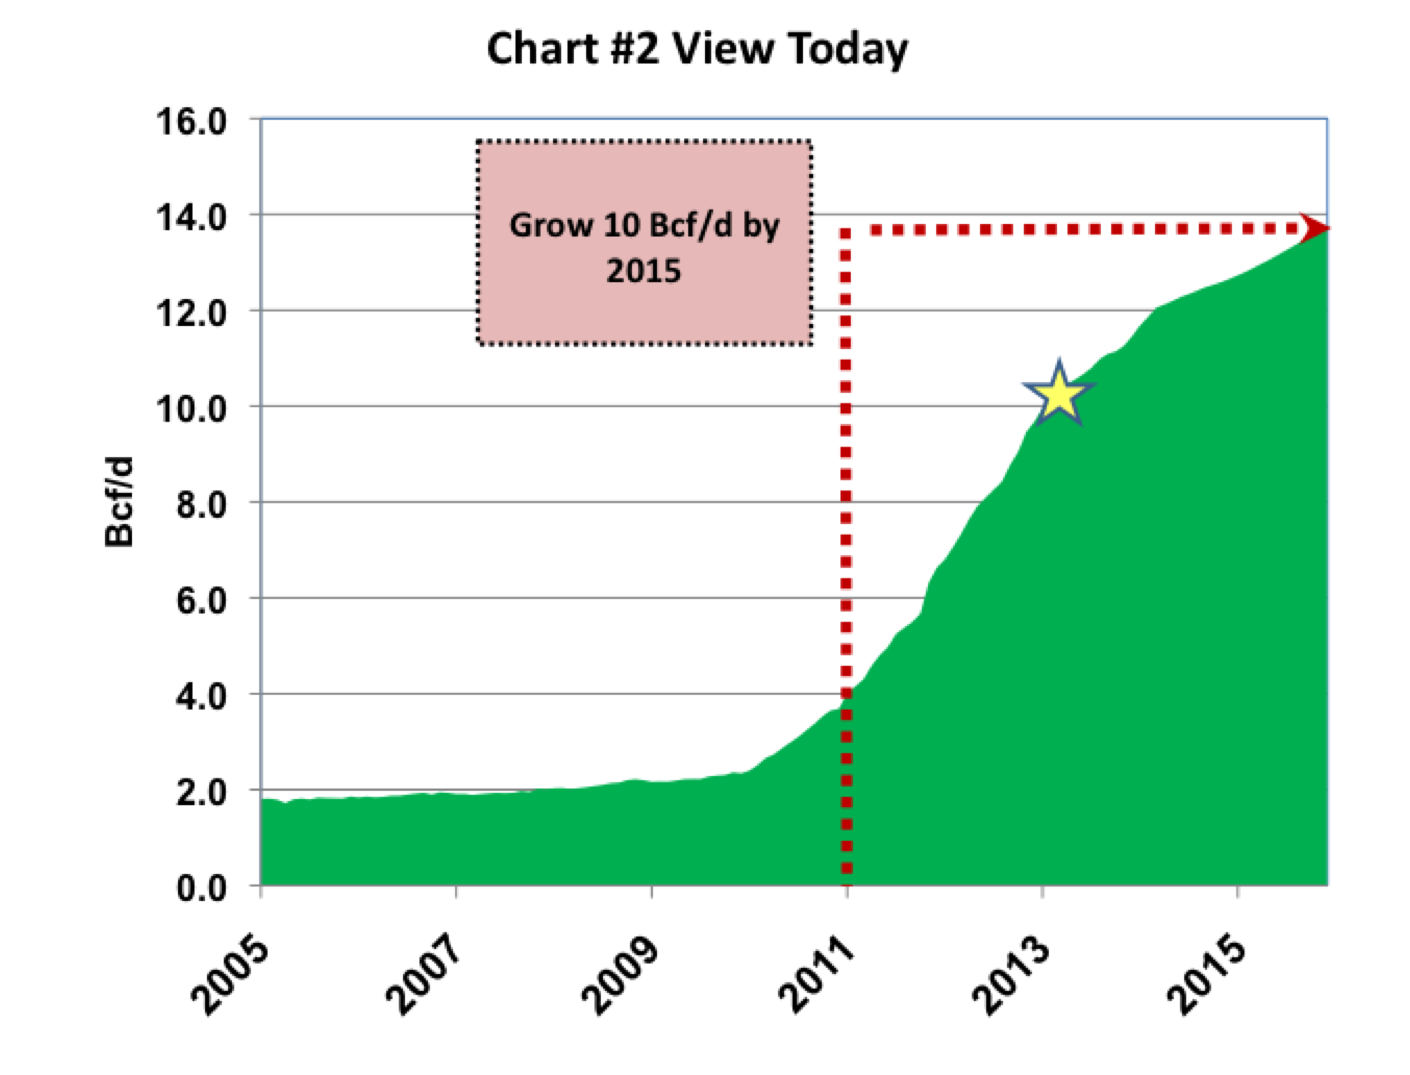
Source: RBN Presentation at Benposium 2013
Here’s the reason why. Starting next year during parts of the year with lower demand, the Marcellus and Utica will be producing more gas than the northeast region can absorb. Chart #3 below shows northeast production (largely coming from the Marcellus and Utica) and the outlook to 2018 (green shaded area). The range for demand is the pink shaded area along the top of the chart. The demand range fluctuates throughout the year reaching its high point during the winter and its low point during the summer. You can see that production this year will start to exceed demand during the summer months. Every year that goes by it will get worse – or better, depending on whether you are a seller of gas or a buyer. The consequence of this change will be to change everything that we thought we knew about gas flows here in the US.
Comments
Great article as usual! How do you think this all will impact Marcellus producers? Seems like they should be fine assuming there is enough takeaway capacity of the region? Do you think bottlenecks are likely to occur similar to what happened with oil getting out of the Bakken? Thanks!
This is a great article, which highlights the difficult task of trying to forecast gas and liquids production. I just have a couple of followup questions..
Do you think there exists a scenario in which the Marcellus gas (& Utica) will make it all the way to the south, say to Henry Hub or other markets along the gulf coast? Will marcellus well costs plus shipping be low enough for such scenario to materlialize in the future?
Given such strong growth in Northeast gas production, do you think there will be a market for NE gas through LNG expots from that region?