A couple of years ago in December 2012 we posted a blog in our Oh-Ho-Ho It’s Magic series covering the bigger Gulf Coast crude oil supply picture. At the time we wanted to provide a summary view of all the changing crude flows happening at the Gulf Coast. Back then the Seaway Phase 2 and TransCanada Cushing Marketlink pipelines from Cushing to the Gulf Coast had not opened up and there was over 50 MMBbl of crude stuck in Cushing inventory. Things are a lot different today. Today we break down the crude balance for the Gulf Coast - PADD (Petroleum Administration Defense District) III region since the start of 2011.
Our analysis in this blog is based on monthly data from the Energy Information Administration (EIA) that was last updated for June 2014 (on September 2, 2014). We believe that EIA capture most of the crude data relevant to this balancing exercise with the exception of crude movements into and out of PADD III by rail. These movements have increased over the past 3 years significantly, but we don’t know of an accurate data source. In today’s analysis we build out a chart (see Figure #1) showing the historic supply demand balance since January 2011. In the next episode in this series we will develop a forecast that extends out to 2019.
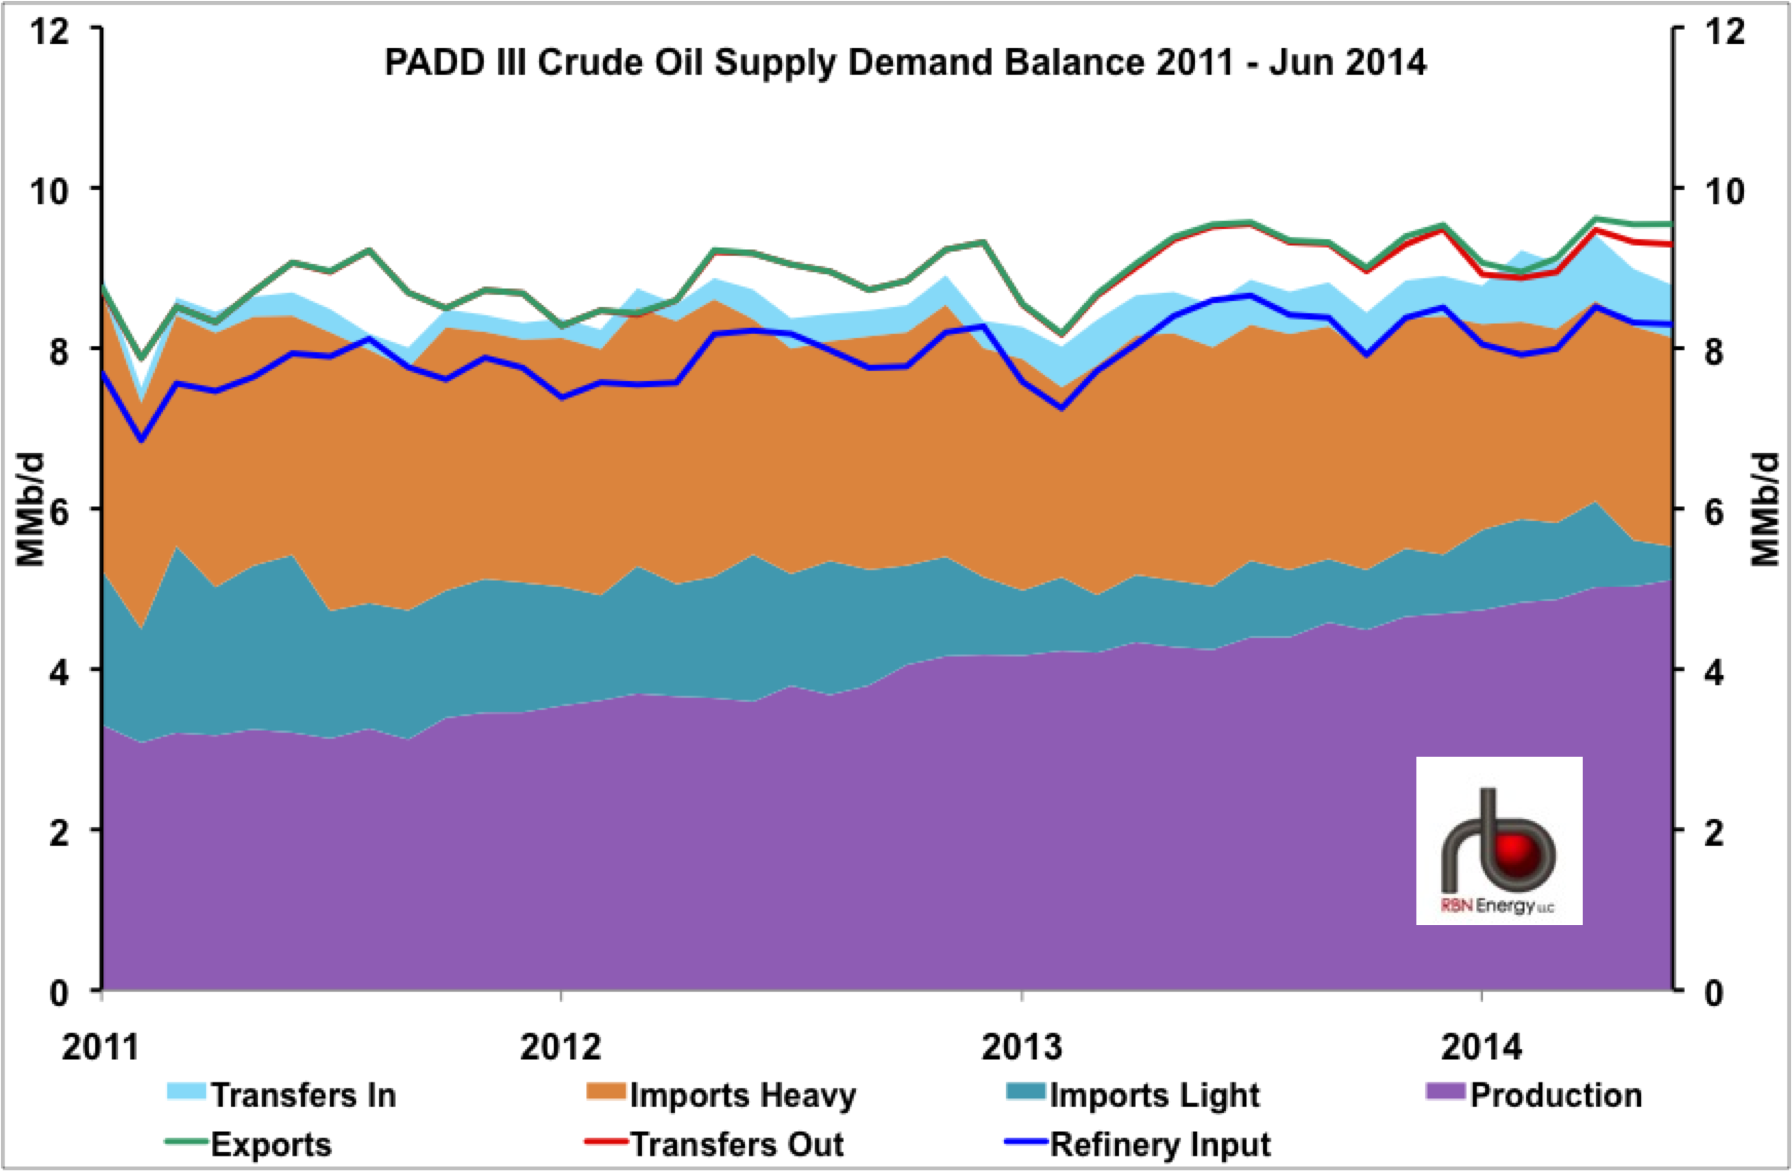
Figure #1
Source: EIA, RBN Energy (Click to Enlarge)
Supply
The supply side of the crude balance is made up of the following inputs:
Crude production: Monthly crude production from EIA data for PADD III (purple shaded area on the chart) that includes two of the big three domestic shale production basins – Eagle Ford and Permian in Texas and New Mexico. To these basins are added production from the offshore Gulf of Mexico as well as onshore eastern Gulf Coast production in Louisiana, Mississippi, Alabama and Arkansas. Gulf Coast crude production has jumped 57 percent from 3.3 MMb/d in January 2011 to 5.2 MMb/d in May 2014.
Waterborne Imports of Light Crude: Monthly imports of light crude – defined as 31 degrees API gravity or higher – from EIA company level data (teal shaded area on the chart). Light crude imports have declined over the past three years from 1.9 MMb/d in January 2011 to only 0.4 MMb/d in June 2014. The remaining light crude imports are sour crude barrels – with a sulfur content over 0.5 percent – mostly supplied by Middle-Eastern producers.
About the song
Stocks and PADDs and Export Rules is a variation on the song title “Sex and Drugs and Rock and Roll” written by UK artist Ian Dury and Chas Jankel and originally recorded in 1977