The US Gulf Coast region hosts nearly half the nations refining capacity. Crude oil supply into the region will undergo a revolution in the next two years. The Ho-Ho reversal pipeline project is just one reconfiguration among many that are being made in response to historic changes in the source and destination of crude flows to refineries. Today we conclude our series on new crude flows into the Gulf Coast.
In Part 1 of this series we detailed Shell’s planned early 2013 completion of the eastbound Houston, TX to Houma, LA (Ho-Ho) pipeline reversal as well as the proposed 2015 Westward-Ho pipeline from St. James to Houston. In Part 2 we described the new pipeline capacity coming online between now and 2015 that will move 3.1 MMb/d of incremental crude into the Houston area. The Ho-Ho reversal project will help to distribute some of this crude from the Houston area to the Louisiana Gulf but not enough to prevent oversupply in Houston. A similar oversupply situation may arise on the Louisiana Gulf Coast until the Westward-Ho pipeline re-opens the previous Ho-Ho westbound link from St James, LA to Houston. All of these changes will create a new crude supply paradigm at the Gulf Coast with waterborne imports to that region (currently running at close to 4 MMb/d) being pushed out by new inflows from domestic and Canadian production.
Since we published Part 2 last Monday (November 19, 2012), two developments have added new dimensions to the crude supply outlook for the Gulf Coast region – both of them concerning the Permian basin. First crude production in the Permian basin is increasing so fast that it is outpacing takeaway capacity on existing pipelines into Cushing. When we took our first look at Permian pipeline capacities (see The New Adventures of Good Ole Boy Permian Routes to Market) we noted that current takeaway routes direct everything into the crowded Midwest market via the Basin (450 Mb/d) and Centurion (175 Mb/d) pipelines into Cushing and the West Texas Gulf (300 Mb/d) pipeline into the Midwest. The pressure of crude building up in Midland, TX, trying to get to Cushing last week led to the discounts for Midland crudes – both West Texas Intermediate (WTI) and West Texas Sour) against the price for those grades in Cushing – jumping $15 in the space of a day to more than $20/Bbl – the lowest ever. A $20 discount for WTI crude in Midland versus WTI Cushing is about 30 times the published pipeline tariff from Midland to Cushing on the Basin pipeline ($0.69/Bbl). The supply situation is officially boiling over in advance of the first pipelines bringing relief to the Permian glut early next year.
The second new dimension to regional crude supply was precipitated by comments last week by Kinder Morgan that they are contemplating repurposing an existing natural gas pipeline that runs from El Paso to California, to carry 300 to 400 Mb/d of crude from the Permian Basin to California refineries. That idea is still at a very early stage but it tells us two things. First that there is now real interest to move crude over 1000 miles west in the opposite direction from the huge Gulf Coast refining complex – in search of a better price – effectively confirming the assessment that the Houston market will be oversupplied in the next two years. Second, that Permian producers are already searching for additional new capacity in spite of the 700 Mb/d expected online in the next two years.
With all that in mind, we turn now to the big picture in the hope of making some sense of all the changing flows of crude oil that new pipelines are bringing to the Gulf Coast region.
To create that picture we looked at the Energy Information Administration (EIA) data for PADD 3 (the Gulf Coast region) to review the latest crude supply/demand position and to project what is likely to happen over the next two years.
The latest EIA PADD 3 data is for August 2012. The chart below shows the EIA data history back to the start of 2008. To that history we have added a projection of what the changing supply picture will look like up to the end of 2014 based on the new crude supply paradigm. Warning – this chart contains a lot of detail – we will spend the rest of this blog explaining it but we believe that putting all this into one picture will enhance your understanding of what is going on. To help, we attach a PDF version of the chart at the end of the blog that you can download if it is not easy to read in your browser. As always, drop us an email to [email protected] if you are not able to download the attachment and we will send you a copy.
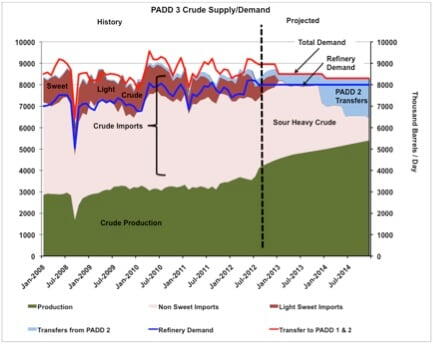
Source: History from EIA, Projections from RBN Energy
All the data in the chart is expressed in thousand barrels of crude per day. The red and blue lines are PADD 3 crude demand. The blue line is refinery demand for PADD 3. The red line is the total demand for PADD 3 meaning refinery demand plus transfers to PADDs 1 and 2 (more on these definitions in a minute). The supply values are the shaded areas. The green area is PADD 3 crude production. The pink and brown areas together represent crude imports to PADD 3 (coming into the Gulf Coast). The pink area represents heavy and sour crude imports, the brown area is light and sweet crude imports. The light blue area represents crude transfers from PADD 2 to PADD 3.
Lets start with the headlines. The chart shows three major supply trends over the projected period. The first is that crude production (green area) is increasing. The second is that movements into PADD 3 from PADD 2 (blue area) are increasing from 2013 forward. The third is that crude imports are declining. Within the crude import data (pink and brown areas) you can also see that light sweet crude imports (brown area) fall to zero early in 2013.
The two demand trends on the chart are first that refinery demand in PADD 3 (red line) stays level throughout the projected period until the end of 2014 and second that transfers of crude to PADD 2 (blue line) decline.
There is a lot of information to digest in this chart so we will define the data and review some assumptions we made for our projections in detail here:
- Crude Demand
- Refinery Demand - about 8 MMb/d in 2012 and assumed to be flat over the next 2 years to 2014
- Transfers to PADD 1 & 2 – this is primarily the flow of crude from the West Texas Permian basin into the Midwest – mostly Cushing. These exports were just under 1 MMb/d in August 2012 and we assumed that this volume declines to 0.5 MMb/d in 2013 and 0.3 MMb/d in 2014 as a result of Permian crude flowing instead to the Gulf Coast (due to new pipeline capacity and better pricing) and Bakken supplies replacing West Texas crudes used in the Midwest.
- Crude Supply
- Production – meaning crude production in PADD 3 largely from three basins - the Permian Basin, the Eagle Ford and the Gulf of Mexico. PADD 3 crude production for August 2012 was 3.5 MMb/d. We project an increase to 5.4 MMb/d by the end of 2014 based on industry estimates and the latest Bentek numbers for growth in Permian and Eagle Ford production
- Transfers from PADD 2 – the flow of crude (from North Dakota and Canada) via Midwest pipelines into the Gulf region. During 2012 that flow was between 200-300 Mb/d and our assumption is that it will stay at 300 Mb/d until the end of March 2013. From that point we projected crude flows based on the new pipeline capacity on the Seaway and Keystone pipelines that will reach about 1.9 MMb/d by December 2014.
- Imports into PADD 3. Foreign waterborne crude imports in August 2012 were 4.5 Mb/d and our projection is that these imports will decline in the face of increased crude production in PADD 3 and increased crude transfers from PADD 2. Waterborne imports are the balancing factor in our projection! – they are reduced by the quantity required to balance PADD 3 supply and demand. The breakdown of light and heavy crude imports (see below) is estimated because the EIA only publishes crude quality data at the national level.
- Light Sweet Crude Imports into PADD 3. The light sweet crude import projections are that these supplies will be backed out of the Gulf Coast as new light crude supplies reach the Texas Gulf Coast from the Permian basin or from PADD 2 via Cushing when new pipeline capacity opens up. Based on our projections and discussions with our friends at Turner Mason we project light sweet imports drying to a trickle early in 2013.
- Heavy Sour Crude Imports into PADD 3 have represented the majority of Gulf Coast imports since 2008. These imports decline as new pipeline capacity brings more domestic and Canadian crude to the Gulf Coast
- Inventory. So as not to add insult to an already busy picture, we did not include inventory data in our actual or projected data but we expect Gulf Coast inventory to play an important role in balancing the new crude supplies with demand and foreign imports. Where you see a gap between the red line on the chart (total demand) and the shaded areas (total supply) that gap represents a stock drawdown.
- Rail Movements. We made no attempt to include rail movements in our data because EIA does not include that data in its surveys at present. It is likely that rail movement will play an important role in the supply/demand balance. For example, rail movement of crude oil from the Permian to the West Coast would back out West Coast imports while reducing the level of Gulf Coast imports backed out. There are a lot more situations like this that will emerge as all of this plays out.
We are the first to admit that attempts to project what may happen in such a radically changing market are subjective at best. . However, the overall supply/demand trends we capture in our chart are already underway. Crude production is increasing faster than expected. Imports of light sweet crude have already declined. The flow of new crude from PADD 2 into the Houston region will pick up in earnest during the first quarter of next year. Within that overall picture, the Ho-Ho reversal represents a small but vital link between the Texas and Louisiana Gulf refinery markets. As our supply/demand picture makes clear however Ho-Ho is a small cog in far larger trends that will bring many more changes for refiners, producers and crude importers over the next two years. In the midst of those larger trends you can bet that there will be many more disruptive market events like the dramatic price discounts for West Texas crudes that we saw in Midland last week.