Exports of liquefied petroleum gases (LPGs – propane and butane) from the U.S. to international markets - are expected to nearly double from 460 Mb/d in 2014 to 915 Mb/d in 2019 as production from gas plant processing exceeds domestic demand. Available Very Large Gas Carrier (VLGC) vessels to carry these increased overseas volumes are limited. As a result spot freight rates have reached record levels recently. In today’s blog “Stayin’ Afloat With the LPGees – Part 4 Freight Voyage Calculation Model” Sandy Fielden walks through a voyage cost calculation. Today we walk through a voyage cost calculation.
Recap
This blog series is designed to help RBN members better understand the nuances of the international LPG market in light of increasing U.S. waterborne exports of propane, normal butane and isobutane – known collectively as liquefied petroleum gases or LPGs. From the U.S. perspective, that involves getting to grips with unfamiliar terminology used to measure quantities, prices and shipping volumes overseas. We began our odyssey in Episode 1 with a primer on international weights and measures as well as conversion factors. In Episode 2 we looked at the different ships used to carry LPGs. We reviewed the four main gas carrier vessel types from the largest – VLGCs down through large gas carriers (LGCs), medium gas carriers (MGCs) and smaller gas carriers. In Episode 3 we dug into the freight chartering process covering the charter types for VLGCs (and for other bulk liquid tanker vessels) namely; Voyage Charter – usually based on a spot $/MT rate (owner does everything), Time Charter (TC)– renting the vessel for a fixed period (charterer paying voyage costs), Bareboat Charter (BB) – leasing the vessel and charterer paying all costs, and Contract of Affreightment (COA) based on a volume of product shipped over time. In most cases the choice comes down to paying a voyage charter for a specific cargo or negotiating a time charter to rent the vessel for a fixed period. In this episode we present a simplified LPG freight voyage calculation and illustrate how a charterer (or an owner) can compare a spot voyage rate with a time charter equivalent (TCE).
The voyage calculation example that we are using comes from a proprietary spreadsheet provided exclusively for our recent School of Energy attendees by Joachim Grieg & Co. We walk you through the calculation for a 44,500 metric ton (MT) VLGC propane cargo taking the same route as the Baltic Gas Index benchmark voyage - a round trip from Ras Tanura (Saudi Arabia) to Chiba (Japan) laden (loaded) and back to Ras Tanura in ballast (empty). You can recreate this model based on our description of the calculations below.
Voyage Charter –Total Freight Rate
First we calculate the total freight rate for the voyage charter. This is a straight forward negotiated spot freight rate that the charterer pays – after which the owner takes care of all the costs – including crew, fuel, loading and discharge, except for demurrage delays (more on demurrage later). The fee is a spot freight rate of $50/MT multiplied by the cargo size 44,500 MT for a total of $2,225,000.
Next we break down the total freight rate to separate out the voyage costs. These voyage costs are the difference between the rate you pay for a voyage charter and the rate you pay for a time charter. In a voyage charter the vessel owner pays the voyage costs. In a time charter the charterer pays the voyage costs. By estimating the voyage costs we can compare the two ways of paying for the vessel. We start with the vessel cost variables.
Vessel Cost Variables
The variables related to vessel costs are listed in Figure #1 below. These variables depend on the speed and fuel consumption of the vessel as well as its size. To make things easier we refer to the variable by name and column/row cell reference in Figure #1. Cell H4 is the vessel speed on the laden leg of the voyage in knots (nautical miles) per hour. Both the laden and ballast speed (cell H6) are the same in our example. The consumption laden (cell H5) is the amount of bunker fuel that the vessel consumes when full in MT/day. Consumption ballast is the fuel/day on the return voyage empty (cell H7). Fuel consumption in port (cell H8) is an estimate of how much bunker fuel (MT) in total the vessel will consume while loading and discharging in port. The weather factor in cell H9 is an input variable that increases or decreases the length of the voyage to account for expected weather conditions en-route. In this case the factor is a standard 5 percent that adds to the voyage distances. The bunker price (cell H10) is the cost of fuel oil for the ship, quoted in $/MT – a market price that may be obtained from various price reporting services. The broker commission is a fixed 1.25 percent of the total freight costs for the VLGC voyage (calculated in a minute). Broker commissions tend to be 2% for smaller ships below Handy size (23,000 Cbm), but can vary depending on the deal.
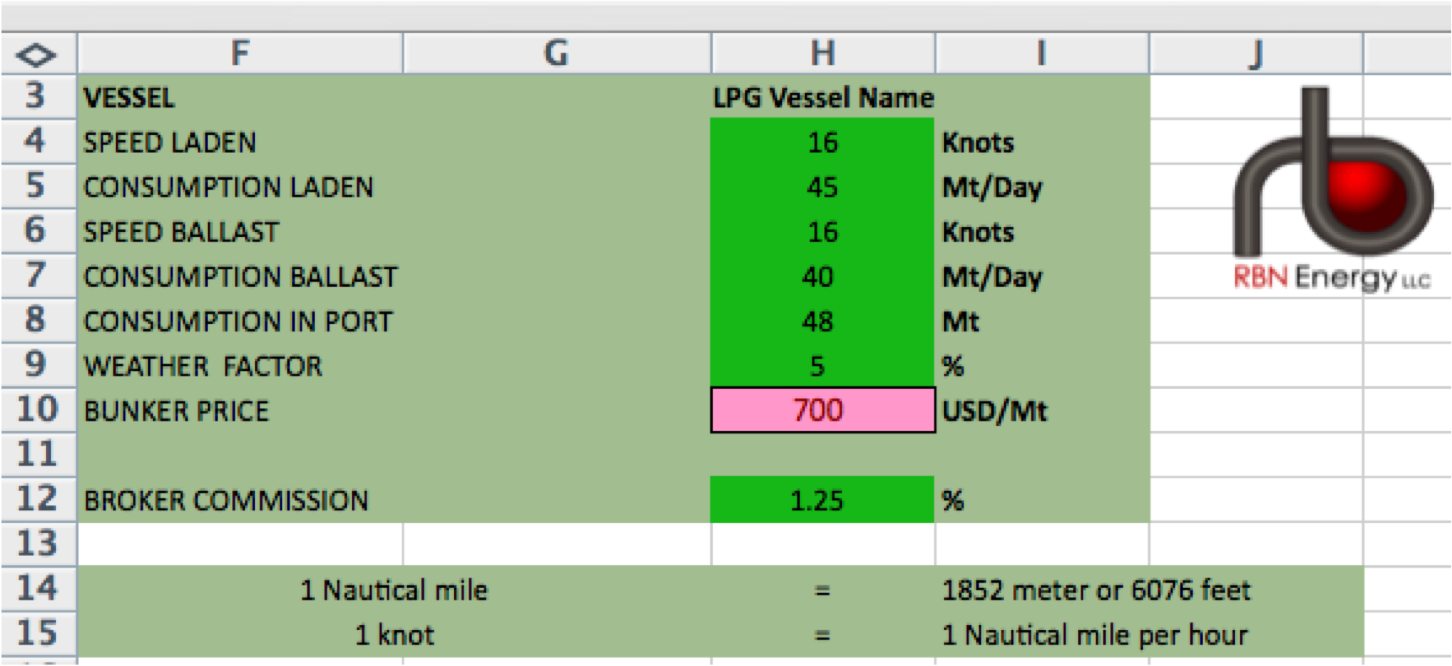
Figure #1
Source: Joachim Grieg (Click to Enlarge)


Comments
2014/04/23 $/MT Mt Belvieu/".." spread Freight Houston-"..." RV ($/MT) ARB US/".."($/MT)
JAPAN CHIBA CFR 910 -$335/mt 218 37
ARA CNF 768 -$193/mt 84 29
Persian Gulf FOB 788 -$213/mt 135 (2)
Mt Belvieu (OPIS) hub 575 - -
Baltic RAS TANURA/CHIBA is assessed at $128/mt, Platts says lpg fob assessment, at +80/MT over the non-lst Mt. Belvieu. I don't think that the East-West LP arb is open except for the U.S because Japan/Persian Gulf spread is less than Baltic assessed freight. Saudi Aramco's biggest competitor is now the freight market.
2014/04/23 $/MT Persian Gulf/Japan spread Freight Persian Gulf-"Chiba" RV ($/MT) ARB ($/MT)
JAPAN CHIBA CFR 910 122 $/MT 128 $/MT (6)
Ras Tanura FOB 788
This freight rally is overdone but the market (fleet owners) doesn't think it is over yet ! With the upcoming summer bbq season, it will be funny to see how things will go in the U.S...knowing that U.S LP doesn't need exports to survive. Should the U.S demand pinchs back => unfavorable spreads could play tricks.
Simon