Last week US crude oil production reached 8.4 MMb/d – its highest level since October 1986 – up 50 percent since the start of 2011. The engines of growth are Texas and North Dakota and within those states, horizontal drilling in tight oil shale are generating the most exciting results. And while production is soaring, proved reserves are increasing even faster – laying the groundwork for continued output. Today we look at past, current and future US crude production growth.
US Crude Production Growth
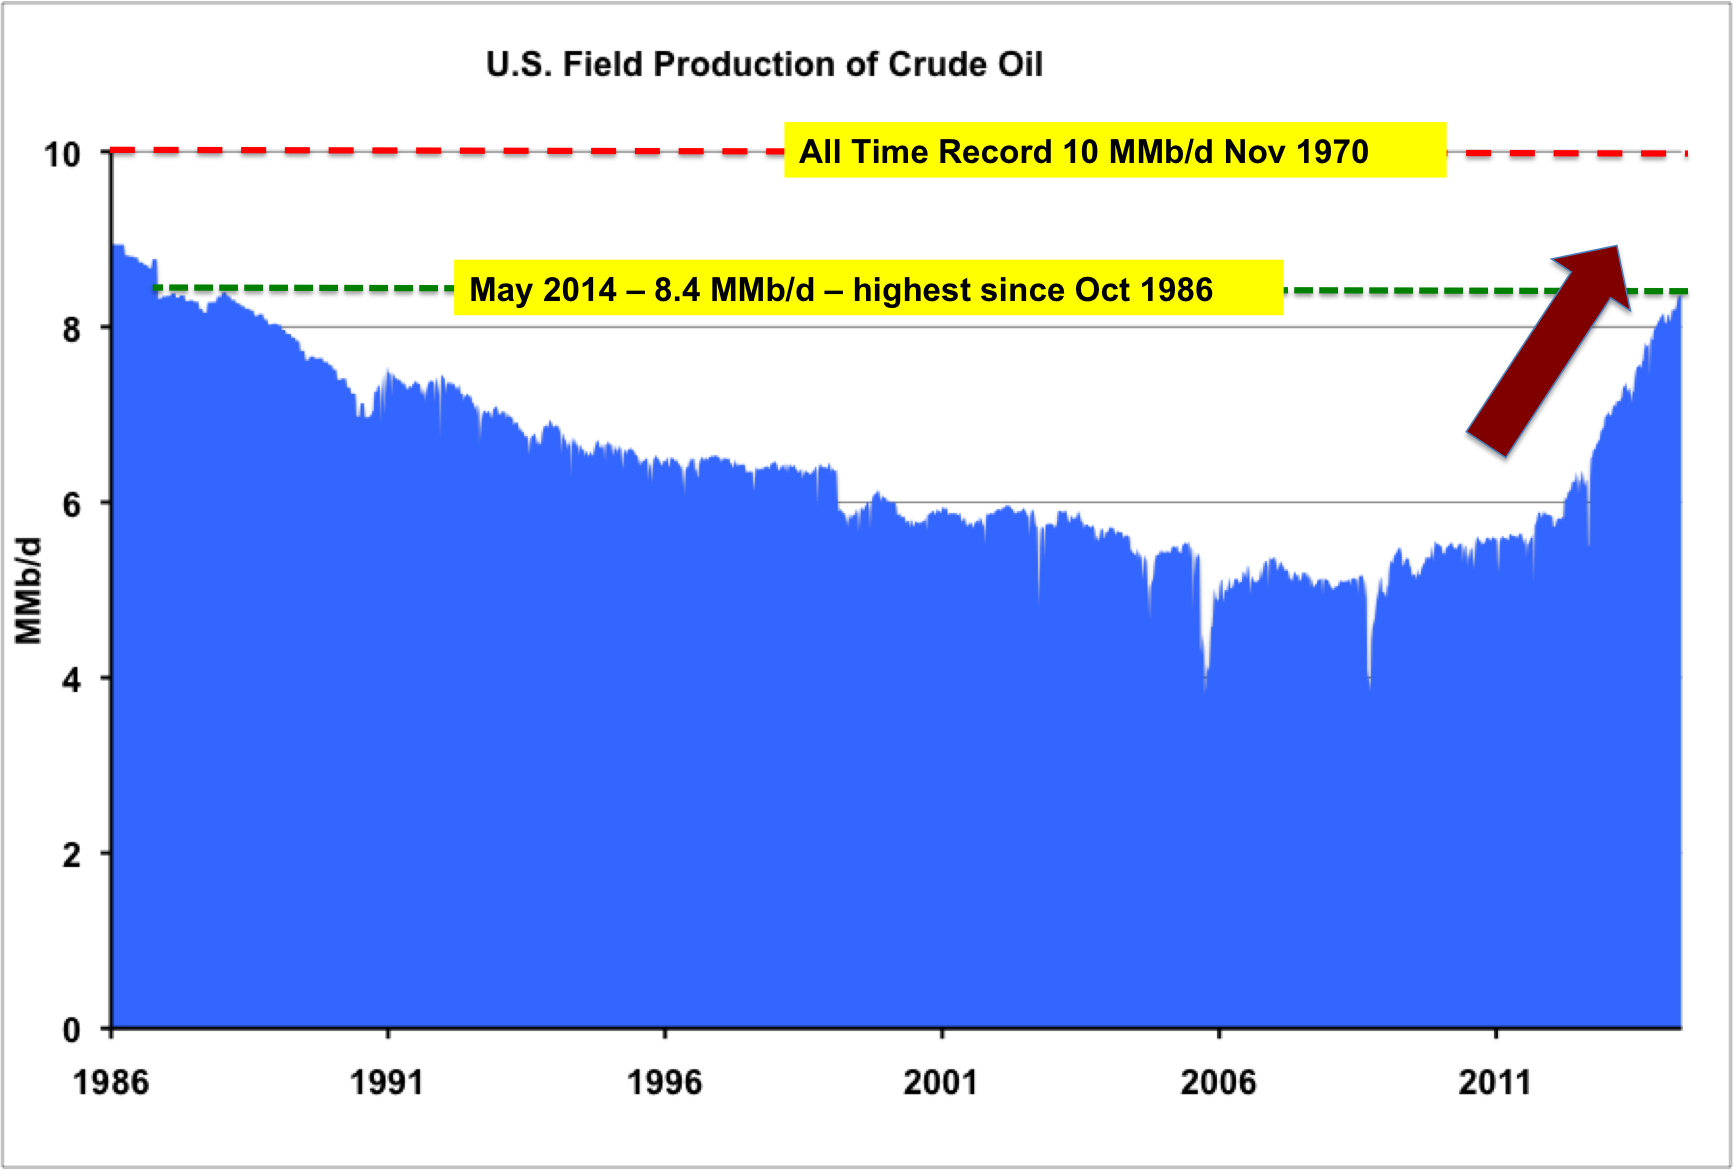
Figure #1
Source: EIA Weekly Crude Production (Click to Enlarge)
US crude oil production has been on a roll over the past three years. Figure #1 shows Energy Information Administration (EIA) US weekly crude oil production data since 1986. The latest crude production figure for the week ending May 16, 2014 is 8.4 MMb/d - the highest value since October 1986 (the green dotted line on the chart). As indicated by the brown arrow, crude production is up 51 percent since the start of 2011. Looking back in history the EIA data indicates that the record for US crude oil production was set in November 1970 – 44 years ago – at just over 10 MMb/d – the red dashed line on the chart. RBN expects production to surpass that level by 2019.
While crude oil production is up sharply in the past three years, there is still room for imports to meet overall US demand, although these are at their lowest level since 1998 (about 7.0 MMb/d) and increasingly are sourced from Canada (about 2.5 MMB/d of the total), up 0.6 MMb/d over the past three years. But even as imports decline, US refineries have not been able to keep pace with rising crude production – much of which is lighter in density (API Gravity) than they are configured to handle (see Charge of the Light Brigade). The mismatch in crude quality is compounded by US Department of Commerce regulations banning the export of crude oil except to Canada and in specific circumstances from Alaska or California (see I Fought the Law). With exports restricted and refineries not configured to consume all the rising production, crude inventories reached their highest level since EIA records began – at just under 400 MMbbl for the US as a whole at the end of April 2014, with more than half those barrels being stored in the Gulf Coast region (210 Mb/d as of May 16, 2014).
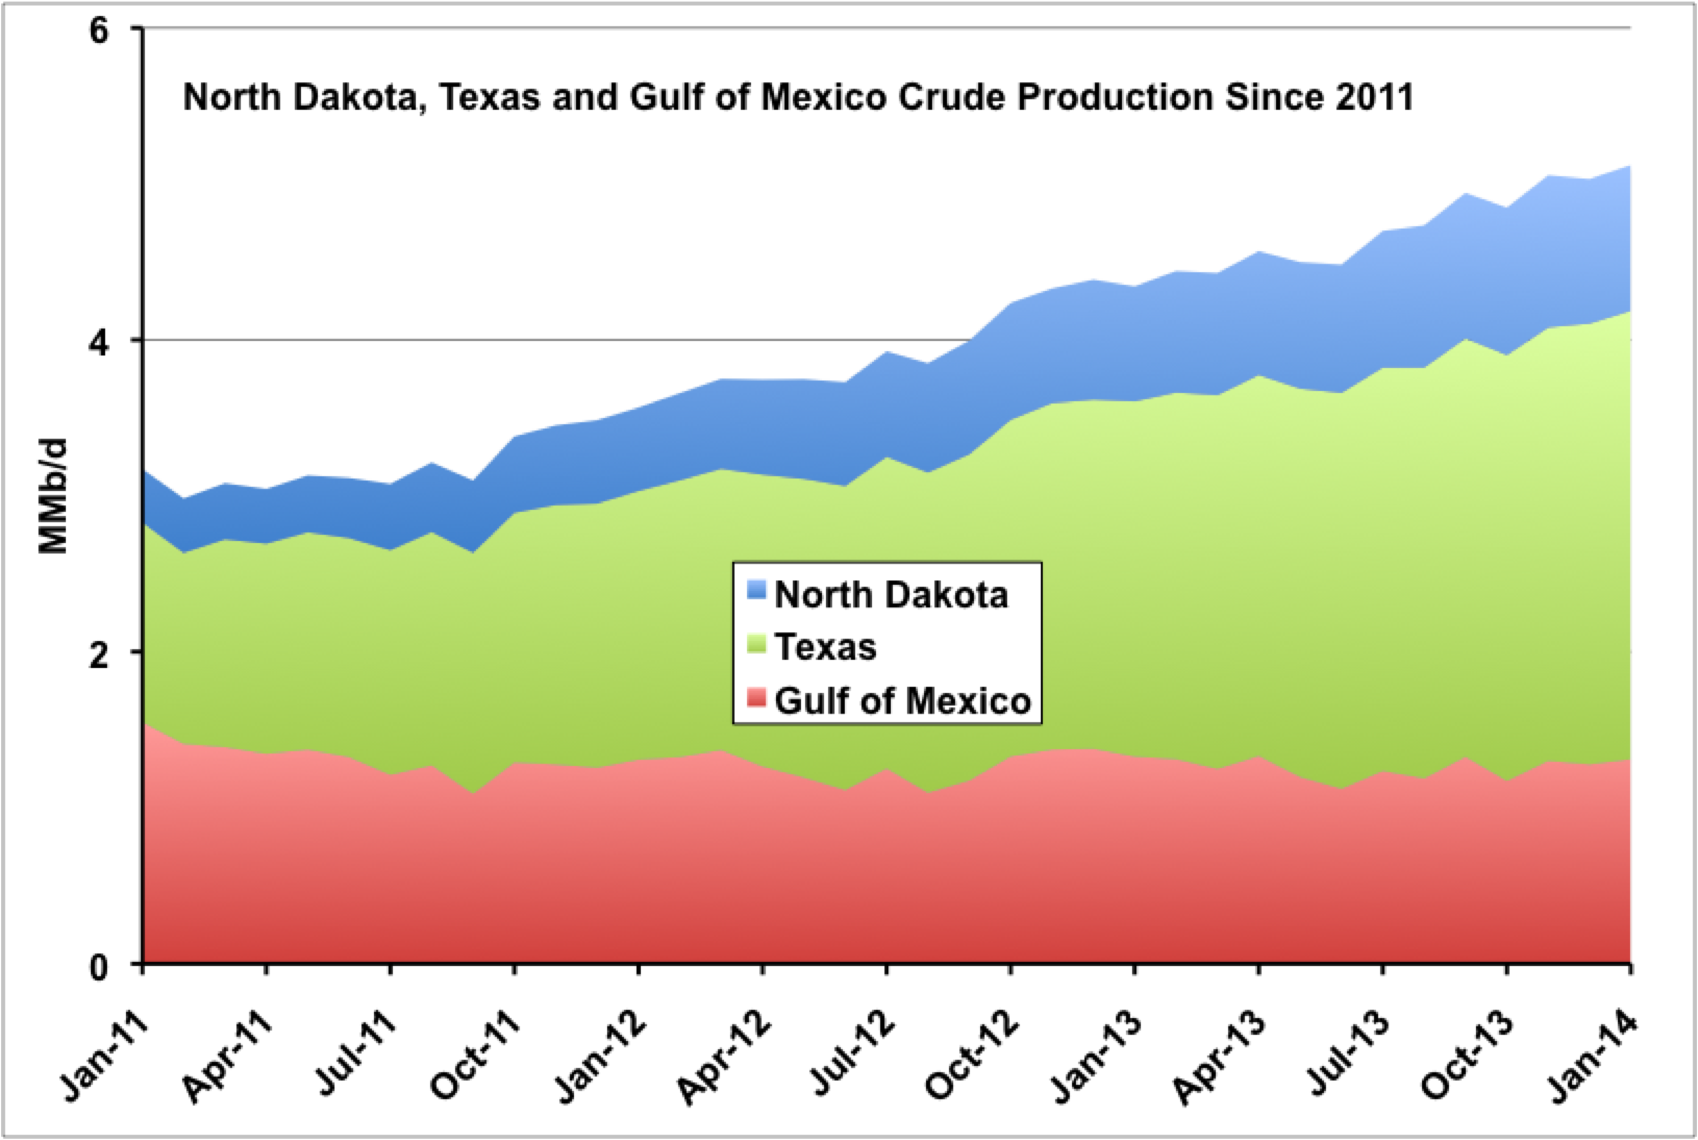
Figure #2
Source: EIA Monthly Crude Production (Click to Enlarge)
Where is increased crude production coming from? Just three regions represented 64 percent of total US crude production in January 2014 (5.1 MMb/d out of 8.0 MMb/d). These three regions are North Dakota – home of the majority of Williston Basin Bakken crude production, Texas – the home of the prolific Eagle Ford and Permian Basins and the offshore Gulf of Mexico (GOM). Monthly production for each of these three regions is shown in Figure #2 since the start of 2011.
Looking at production in these three regions since 2011 illuminates the US crude production revival. The numbers tell a story of dramatic increase in production in North Dakota and Texas while GOM output declined over the same period. Of the three regions, in January 2011, North Dakota represented just 6 percent of total US production at 0.3 MMb/d, the GOM was 1.5 MMb/d or 28 percent of the total and Texas was 1.3 MMb/d or 23 percent of the total. Three years later in January 2014, North Dakota output had tripled to more than 0.9 MMb/d or about 12 percent of US production. The GOM had fallen to 1.3 MMb/d or 16 percent of the total and Texas more than doubled to 2.9 MMb/d or 36 percent of US production.
Within the State of Texas, the surge in Eagle Ford production has been meteoric – rising from 50 Mb/d at the start of 2011 to 1.4 MMb/d today. But the Permian Basin in West Texas has been producing oil for nearly 100 years and output there has recently begun to take off again. This long running West Texas oil and gas rainmaker has experienced significant increases in drilling – specifically horizontal drilling – in the past few months resulting in even faster production growth (see Stacked Odds – Why Producers Like Their Odds in the Permian). Our latest RBN Energy Drill Down Report on production drilling economics aptly illustrates how producers who crack the horizontal drilling and hydraulic fracturing code in the Permian can expect typical rates of return of 60+ percent (for more information on the Drill Down Report – available only to our Backstage Pass subscribers, see Stacked Deck in the Permian). Overall, the Texas Railroad Commission reported recently, Texas produced more oil in 2013 than it had in decades and is poised to surpass those totals again in 2014 as the number of wells drilled has nearly doubled so far this year.

About the song
“Bat Out of Hell” was a hit album and single for Meatloaf in 1979, and served as the title of two later Meatloaf albums: Bat Out of Hell II: Back Into Hell in 1993 and Bat Out of Hell III: The Monster Is Loose in 2006. A musical based on the songs in the original album is set to debut in the UK in February 2017.