

For most of us, matching spending with income is the logical path to financial stability. However, after decades of aggressive investment in search of growth, the “dollars in equals dollars out” method of allocating free cash flow has been an adjustment for many U.S. oil and gas producers. Their post-pandemic concentration on keeping capital spending well below inflows, maintaining healthy leverage ratios and directing excess funds to reward shareholders with dividends and stock buybacks has revitalized the industry and restored investor confidence. But ebbing commodity prices have upped the difficulty of this quarterly zero-sum game. In today’s RBN blog, we will analyze the shifts detected in Q2 2025 cash allocation of the 38 major U.S. E&Ps we cover.
Analyst Insights are unique perspectives provided by RBN analysts about energy markets developments. The Insights may cover a wide range of information, such as industry trends, fundamentals, competitive landscape, or other market rumblings. These Insights are designed to be bite-size but punchy analysis so that readers can stay abreast of the most important market changes.
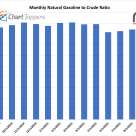
The monthly natural gasoline price for September 2025 stands at 85% of NYMEX crude, reflecting a modest uptick of one percentage point from August’s 84%. However, the ratio remains slightly below year-ago levels, down one point from 86% in September 2024.


The weekly estimate of commercial crude oil inventories in the U.S. Department of Energy’s Weekly Petroleum Status Report — and the week-on-week change in those inventories — are among the most closely watched numbers in the oil sector. And for good reason. After all, the numbers help the market assess shifts in the supply/demand balance, a critical consideration in determining crude oil prices and signaling the need for more — or less — imports, exports, and of course production. In 2017, with a mandated drawdown in the Strategic Petroleum Reserve, it is now important to track weekly withdrawals from the SPR as well because of the effect they can have on commercial stocks. Today we discuss recent and planned SPR drawdowns and their effect on the supply/demand balance and crude oil prices.

New production expected online in December 2017 from the Suncor Fort Hills project in the oil sands region of northern Alberta could increase pipeline congestion from western Canada to the U.S. Gulf Coast market where the oil is in demand. That’s because existing capacity across the Canadian border is running close to full and the only possible capacity addition across before 2019 is Enbridge’s 300-Mb/d Alberta Clipper expansion at the border — assuming it gets a long-sought U.S. Presidential Permit later this year. As a result of this continuing near-term pipeline squeeze, producers are again turning to rail transport to bypass pipeline congestion and ensure their crude gets to market. On June 2 (2017), USD Group announced a new route option for Canadian producers following its purchase of a rail terminal in Stroud, OK, that is connected by pipeline to the Midwest crude trading and storage hub at Cushing, OK; USD will offer direct rail service from its Hardisty, AB, terminal to Cushing. Today we review the economics of this rail transport route for oil sands producers. (This blog is based on a recent note published by Morningstar Commodities and Energy Research.)

Exploration and production companies (E&Ps) in shale basins have a water problem — in fact, they have three water problems. Two are upfront well-completion costs: sourcing water for the frac job and disposal of the flowback water from the frac job. These are nontrivial issues, but they pale in comparison to a much bigger problem – produced water – the water that always comes along with the oil and natural gas out of a well. It is a lot of water; on average in the U.S., somewhere around five to six barrels of water are produced for every barrel of oil that comes out of the ground, more from some basins than others. The Permian, for example, produces six to eight barrels of water per barrel of crude. That’s over 1,000 Olympic-size swimming pools full of water out of the Permian alone each day. And because this water is chock-full of minerals, petroleum residue and especially salt (which makes it brine), producers must dispose of the water in a safe, environmentally responsible manner. They are doing that today. But what happens if Permian production doubles — a distinct possibility. Today we continue our surfing-themed series on the effect of sand and water costs on producer economics with a focus on produced water in the U.S.’s hottest shale play.

By the early 2020s, crude oil flows from the Permian to Corpus Christi are likely to increase by at least several hundred thousand barrels a day and may well rise by more than one million barrels a day. That can only happen, though, if new pipeline capacity is in place to move crude from West Texas to the coast and if enough crude-related infrastructure — storage, distribution pipelines, marine docks, etc. — is developed in Corpus to receive, move and load all that oil. Docks and ship-channel depth are particularly important; the bigger the vessels that Corpus marine terminals can handle, the more competitive Permian crude will be in far-away markets like Asia. Today we continue our series on the build-out of crude infrastructure in South Texas’s largest port and consider Corpus’s ability to load Suezmax-class vessels and maybe even Very Large Crude Carriers (VLCCs).

Crude oil exports out of Corpus Christi have increased sharply in the past few months, hitting a record 11.5 million barrels (MMbbl) in April 2017. And that may be just the beginning; the volume of crude put on ships in the Shining City by the Sea is likely to rise new Permian-to-Corpus pipeline capacity is completed and as new storage capacity, distribution pipes and marine docks being planned to accommodate a flood of Permian oil come online. Today we continue our series on the build-out of crude-related infrastructure in South Texas’s largest port and refining center with a look at rising crude exports and the new projects being planned.

The accelerating trend toward high-intensity completions in the Permian, SCOOP/STACK, Marcellus/Utica, Haynesville and other key shale plays is sharply increasing demand for frac sand. As a result, there's upward pressure on sand prices and there are shortages of certain grades of sand that may continue into 2018. There is also increased interest in developing sand mines near production areas. It’s important to remember, though, that (1) there’s no evidence that sand-supply issues will seriously curtail drilling and completion activity, and (2) higher sand costs can be offset by the production gains that usually come from using a lot more sand. Today we continue our surfing-themed series on sand costs and water-disposal expenses with a look at the forecast for 2017-18 demand for frac sand, sand pricing trends, efforts to develop regional sand supply sources and the bottom-line upside of high-intensity completions.

Today OPEC convened in Vienna, expecting to extend production cuts for another nine months beyond June 30. Both the OPEC and NOPEC countries have generally kept to their commitments since January, which has been extremely good news for U.S. producers; they are enjoying higher prices, steadily improving economics and above all, the opportunity to capture market share from OPEC/NOPEC. Since the deal was announced this past November, U.S. production is up 600 Mb/d — about half of OPEC’s promised 1.2 MMb/d cut — and at this rate U.S. producers will have grabbed all of OPEC’s forgone market share by the end of the year. Put simply, the U.S. has taken on a leading role in international oil markets, and as a result it’s now more important than ever to understand on a more granular and real-time level what’s going on in U.S. crude production, imports, exports and inventory. In today’s blog we examine how U.S. producers have been profiting from OPEC/NOPEC efforts to curtail worldwide supply and prop up prices, and how RBN’s new weekly report, “The Gusher,” tracks the key factors affecting U.S. crude.

Over the past five years, the Corpus Christi area’s ability to refine or ship out crude oil has increased substantially, driven initially by rising production in the Eagle Ford play in South Texas — growth that has since subsided. Now, Corpus is preparing for a coming onslaught of crude from the red-hot Permian, whose producers see the coastal port as the preferred destination for their light crude and condensates. Today we continue a blog series on Corpus Christi’s crude-related infrastructure with a look at what’s already there and how storage and marine-terminal upgrades made over the past few years will be coming in handy.

Rising crude oil production in the Permian and the desire of many producers to get that oil to refineries and marine terminals in Corpus Christi has spurred interest in developing more than 1 million barrels/day (MMb/d) of new Permian-to-Corpus pipeline capacity by 2019. That raises the question of whether the Sparkling City by the Sea is prepared to receive and store all that crude — plus oil from the rebounding Eagle Ford play — and either refine it or load it onto ships. Today we begin a blog series on the potential flood of crude oil from the Permian’s Delaware and Midland basins into South Texas’s largest port and refining center, and how refiners and midstream companies are planning to deal with it.

For the first time ever, a Very Large Crude Carrier (VLCC) carrying Bakken crude has sailed from the Gulf of Mexico to Asia, and more may follow. With the startup of the Dakota Access Pipeline set for June 1, Bakken producers are only days away from gaining easier, cheaper pipeline access to the Gulf Coast, and are looking for new markets. Asian refineries are willing to pay a premium for Bakken-type crudes, and want other types of U.S. crude as well. And every 18 hours or so, a VLCC arrives at the Louisiana Offshore Oil Port—the only U.S. port capable of handling the mammoth vessels—offloads crude and leaves LOOP empty because the port is currently an import-only facility. Today we consider the potential for transporting more light, sweet crude to Asian refineries on VLCCs, either via ship-to-ship transfers or by reworking LOOP to enable exports.

Permian crude oil production and pipeline takeaway capacity out of the region are in a horse race —it’s a close one too, and the stakes are high. Twice in the past few years, Permian production growth has outpaced the midstream sector’s ability to transport crude to market, resulting in negative price differentials that cost many producers big-time. Now, thanks to increased drilling activity and producers’ heightened ability to wring more out of the play’s multistack formations, Permian production is expected to rise by at least another 1.5 million barrels/day (MMb/d) by 2022 —a 60%-plus gain over five years —raising the threat of another round of major price hits, maybe as soon as later this year. Today we continue a blog series on the challenges posed by rapid production gains in the hottest U.S. shale play.

Crude oil production in the Permian’s Midland and Delaware basins continues to rise, and producers in the red-hot shale play are hoping there will be enough pipeline takeaway capacity to handle all that growth. This is serious stuff—the Permian’s success the next few years will depend to a considerable degree on whether producers and the midstream sector can avoid the major constraint-driven price differentials between the Midland, TX hub, and destination markets like the Gulf Coast and Cushing, OK, that already have hit the Permian twice this decade. Today we discuss the prospects for another round of takeaway/price-differential trouble in the Permian as soon as late 2017/early 2018 and again in 2020-21.

Production volumes in the Alberta oil sands continue to inch up as production expansion projects sanctioned in better times — almost all of the projects small in scale — come online. However, several major pipeline projects remain on the drawing board; taken together, they would appear to provide far more pipeline takeaway capacity than the oil sands will need. Which raises two questions: how much incremental pipeline capacity is needed, and which pipeline project or projects are most likely to advance? Today we continue our series on stagnating production growth in the world’s premier crude bitumen area, the odds for and against a rebound any time soon, and the need (or lack thereof) for more pipelines.

The highly attractive production economics of the Permian’s multistacked, hydrocarbon-packed Delaware and Midland basins all but guarantee that the region’s output of crude oil, natural gas and natural gas liquids will continue rising—possibly at an even faster rate than what we’ve seen lately. That raises an all-important question: Will there be sufficient pipeline takeaway capacity in place to keep pace with all that growth? If there isn’t, some Permian producers will suffer from downward pressure on local prices—and that may cause them to have second thoughts about the big bucks they paid to gain access to the best Permian acreage in the first place. A production-growth forecast and a deep-dive assessment of existing and planned pipeline takeaway capacity are at the heart of RBN’s new Drill Down Report on the Permian. Today we provide highlights from the new report.

The Permian may be grabbing most of the energy headlines lately, but a noteworthy share of crude oil production growth the U.S. experiences over the next two or three years is sure to come from the Gulf of Mexico. There, far from the Delaware Basin land rush and the frenzy to build new Permian-to-wherever pipelines, a handful of deepwater production stalwarts are completing new wells — at relatively low cost — that connect to existing offshore platforms. Taken together, these projects are expected to increase the Gulf’s output by more than 300 Mb/d by the end of 2018. Today we look at the Gulf’s under-the-radar growth in oil output and the prospects for continued expansion there.