
For most of us, matching spending with income is the logical path to financial stability. However, after decades of aggressive investment in search of growth, the “dollars in equals dollars out” method of allocating free cash flow has been an adjustment for many U.S. oil and gas producers. Their post-pandemic concentration on keeping capital spending well below inflows, maintaining healthy leverage ratios and directing excess funds to reward shareholders with dividends and stock buybacks has revitalized the industry and restored investor confidence. But ebbing commodity prices have upped the difficulty of this quarterly zero-sum game. In today’s RBN blog, we will analyze the shifts detected in Q2 2025 cash allocation of the 38 major U.S. E&Ps we cover.

To truly understand Cushing — what it does and how it works — you need to know the hub’s assets and how they fit together. RBN’s Cushing Crude Oil Playbook provides the first one-stop, comprehensive guide to the hub’s assets.
As we explained earlier this summer in Mission: Impossible, higher free cash flows from increased commodity prices allowed producers to boost dividends and maintain an elevated level of share repurchases in Q1 2025. Producers funded a hefty $4.6 billion in net acquisition spending while cutting capital investment budgets by 4% to a near-term low 56% of free cash flow. Our universe of E&Ps maintained modest debt repayment and added $376 million to its cash balances.
However, as recently outlined in Wrong Road Again, commodity prices retreated sharply in Q2 2025. The E&P companies we track generated $25.5 billion in cash flow from operations (CFOA), down 12% from $28.9 billion in the prior quarter. Organic capital investment totaled $17.8 billion, yielding a 70% reinvestment rate (dark-blue bar in Capex grouping in Figure 1 below), a five-year high, and generated $7.7 billion in free cash flow (FCF), down from $12.9 billion in Q1 2025. In response, producers slashed Q2 2025 net acquisition spending to $2.2 billion, or 9% of CFOA (dark-blue bar in Acquisition grouping), less than half the acquisition outlays in Q1 2025 (green bar). Share repurchases continued their slide, falling to 10% of CFOA in Q2 2025 (dark-blue bar in Share Repurchases grouping), down from the peak of 17% in 2022 (gray bar). The approximately $2.5 billion in lower M&A spending and $1 billion shaved off buybacks largely offset the decline in CFOA.
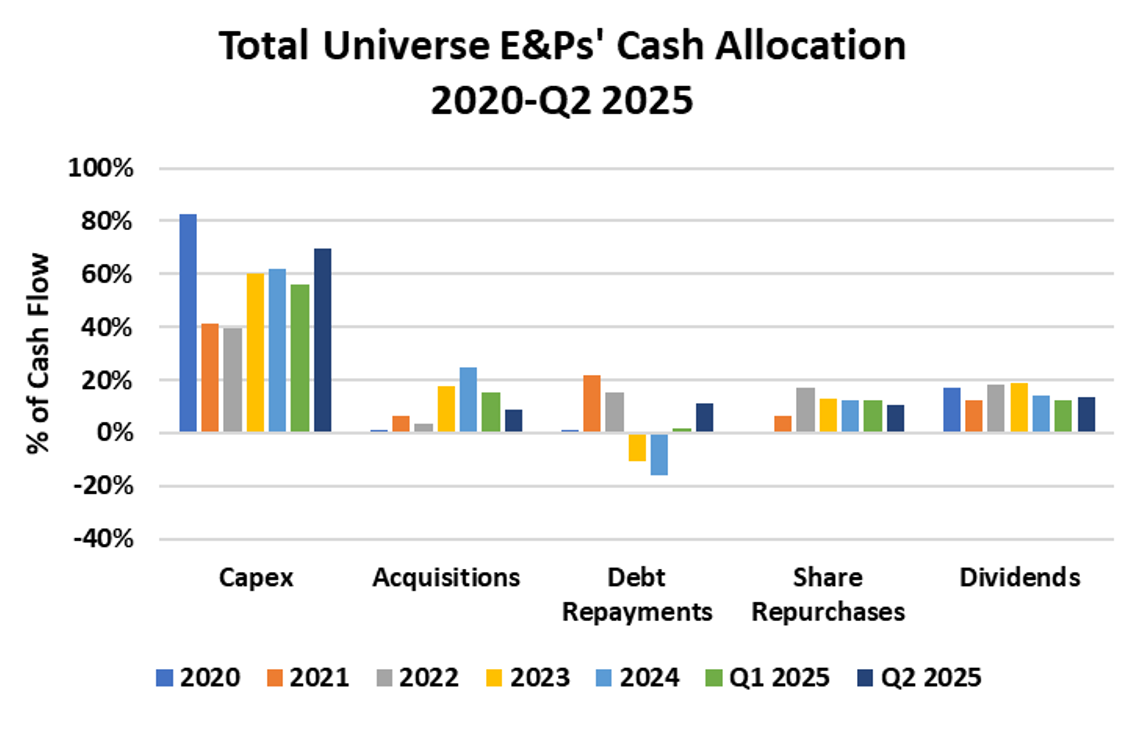
Figure 1. E&P Cash Allocation, 2020-Q2 2025. Source: Oil & Gas Financial Analytics, LLC
One key decision made by producers was to sustain the level of dividend payments as best they could quarter over quarter, despite the lower commodity realizations. And to that end, the cash allocated to dividends was only $100 million lower at $3.5 billion in Q2 2025. A second key decision by E&P managements involved the critical issue of maintaining solid balance sheets in the face of declining cash flows. While some companies dipped modestly into their credit lines to fund acquisitions over the last two years, management decided to draw the line in Q2 2025. Net debt repayments accelerated as $2.2 billion was paid down in Q2 2025; that equaled 11% of CFOA (dark-blue bar in Debt Repayments grouping), far above the amount paid off in Q1 2025 (green bar). As a result, the average debt-to-capital ratio dipped to a five-year-low 24.5% in Q2 2025 (blue bar to far right in Figure 2 below) from a high near 40% in 2020.

About the song
“Zero Sum Game” was written by Mary Claxton, John Burroughs and The Burroughs and is a single released by the band in May 2021. The song is about things that bring us together, not drive us apart. John Burroughs said he “wrote the song to address the rising rhetoric of hate and to call for unity and respect.” The song features Burroughs drummer/vocalist Mary Claxton on lead vocals. A video featuring Claxton and the band was released to promote the single. The song was recorded at Cloverleaf Recording Studio in Evergreen, CO, and produced by John Burroughs and Brian Claxton. Colin Bricker mixed the single. Personnel on the record were: Mary Claxton (lead vocal, drums), John Burroughs (vocals), Alec Bell (trumpet), Brianna Harris (alto saxophone), Hayden Farr (baritone saxophone), Jeremy Fallis (trombone), Brian Claxton (bass), Kelsey Shiba (Wurlitzer electric piano), Tom Amend (Hammond B3 organ) and Sean Hagemeister (electric guitar).
The Burroughs are a nine-piece self-described “sweaty Greeley soul band” formed by bandleader and vocalist John Burroughs in Greeley, CO, in 2013. They have opened for many recording acts at venues across Colorado and appeared at festivals and venues in the U.S. They have released two studio albums, a live album, an EP, and eight singles. They still record and perform live. They will be appearing at various Colorado venues through November.


Comments
I couldn't find EXE on the dot plot in Figure 3. Was there a reason for that?