

More than 70 new data centers are under development in Virginia, which is already the world’s leading hub for the massive, high-tech facilities. But given the rapid pace of the buildout and the challenges that come with it, it’s probably no surprise that not everyone in the Old Dominion State is as enthusiastic about data centers as they once were. In today’s RBN blog, we’ll look at some of the biggest data centers in the works and discuss their path forward.
Analyst Insights are unique perspectives provided by RBN analysts about energy markets developments. The Insights may cover a wide range of information, such as industry trends, fundamentals, competitive landscape, or other market rumblings. These Insights are designed to be bite-size but punchy analysis so that readers can stay abreast of the most important market changes.
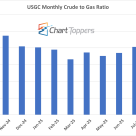
The monthly NYMEX crude-to-gas ratio for September 2025 stands at 21.4, where crude was $63.81/bbl and gas was $2.98/MMbtu, a slight decline from August’s 22.1.
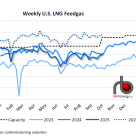
U.S. LNG feedgas demand averaged 15.4 Bcf/d last week (see blue-dotted line in figure below), up 0.1 Bcf/d from the previous week despite lower intake at Cove Point.

The coal to gas switching debate has been raging for months. How much is happening? How long will it last? Could switching continue to increase? Will the generators save the producers from themselves? So far this year, that latter assertion seems to be the case. Additions to natural gas power burn by electric generators have been about the only thing propping up natural gas prices. If the generators weren’t burning so much gas, the storage surplus would be through the roof. Last week EIA announced that natural gas matched coal’s share of U.S. generation for the first time in April. That’s a big deal. In today’s blog “Talkin bout My Generation – Coal to Gas Switching Part I” we uncover the drivers behind the shift to natural gas generation, and set the stage for a deep dive into the longer term implications for gas markets.

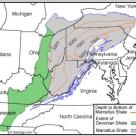
Over the past six months, natural gas production in the Marcellus has continued to ramp up, despite low gas prices and pipeline capacity constraints. It would have grown even faster if capacity had not held back well completions. But new pipeline capacity is coming, and as it comes on line, the production growth rate will accelerate. In the not too distant future, the Northeast will no longer need imports from Canada. Then imports from the Midwest will be backed out. And eventually all inflows from the U.S. Gulf region could come to a halt. That will be a vastly different gas market than we’ve known over the 25 years since decontrol. In today’s blog we’ll drill down into some of the important implications of this, the Great Flow Reversal of 2016.

There is a lot changing in the propane market these days. Propane prices are down hard, hit by the triple whammy of increasing production from wet shale gas, the year of no winter, and constrained Gulf Coast export dock space. Up on top of that, all the petchem crackers want ethane, leaving propane to pile up in Mont Belvieu and Conway, KS storage caverns. The problem won’t be going away anytime soon, and it won’t be limited to Belvieu and Conway. Propane production is surging in the Marcellus. With all the noise over the past couple of years about Marcellus ethane, it seems like the possibility of a significant propane surplus in the region has been under the market’s radar. But it is coming…especially in the summer when local propane demand is at a minimum. Where will the barrels go? Reportedly, one answer is being floated right now. Literally. Propane is being exported on ships from Philadelphia (Marcus Hook), bound for the Caribbean. Now that’s a development that cries out for an analysis of the fundamentals. Perhaps some on-site Caribbean research! But before we get to that, let’s examine the market conditions that are changing the landscape for propane exports so dramatically.
Refiners ultimately determine crude price values. Refining margins vary by location, crude quality, product prices and refinery configuration. Today we return to the Bakken to conclude our series: The Bakken Buck Starts Here – Bakken Crude Pricing Part IV - to discover that a longer journey to market might just be the most profitable.
NYMEX Gasoline futures closed down two cents at $2.62/Gal today. The NYMEX gasoline contract is now down 23 percent since the middle of March. Refiners on the East Coast are heading for the exits. Will gasoline demand recover this Summer? In today’s blog “No Apparent Demand – US Gasoline Thirst Evaporates” we take a closer look at the fundamentals.
NYMEX natural gas closed up again today at $2.767. Its now 26 percent higher than it was two weeks ago. Will recovering prices be reflected in higher sales this quarter? Today in “Uptown Top Ranking” we look at 1Q2012 NGI natural gas marketer rankings to see who is riding high in the charts so far this year and what the rankings mean to the market.
NYMEX WTI crude traded at over $100/Bbl for most of March through May this year. With today’s close at $79.21/Bbl, the price is down 28 percent from this year’s highs. Canadian heavy crude bitumen postings fell to $64/Bbl last week. Could a press release from a small Canadian oil exploration company last week be the first indication of investor concern? In today’s blog, we ask whether Canadian Oil Sands production costs are too high to justify new investment.
Just a couple of days after we talked here in Marcellus Changes Everything about the rupture in the space-time continuum’ between Tennessee pipeline’s Marcellus Zone 4 and the market area Zone 6, prices really blew out. Zone 6 traded last Wednesday at almost $8.50/MMbtu, responding to hot weather, nuclear outages and pipeline maintenance. Poor Marcellus actually fell to $0.88/MMbtu on Tuesday, before seeing some response to the blowout 100 miles down the road and getting to $1.75 on Thursday. But that only lasted as few hours. See our updated Zone 6 versus Zone 4 differential graph below. Why would we see such a blowout this time of year? Is this the kind of price behavior we can expect in the Northeast in the shale era? Today we’ll take a look at these questions and more related to Marcellus shale production and natural gas pipeline capacity in the Northeast.
Crude prices closed down again yesterday at $78.20/Bbl - their lowest level since last October. Gasoline and heating oil also posted new 2012 lows. Sadly, falling oil prices won’t help beleaguered East Coast refiners stay in business. Refinery closures in the region are heading towards 40 percent of last year’s capacity. How will the region secure refined product supplies without refineries? In today’s blog we look at the logistics of replacing diesel and heating oil supplies.
Crude prices closed yesterday at $81.90/Bbl - an 8 month low. Gasoline and heating oil also posted 2012 lows. These falling prices come on the heels of a tough year for East Coast refiners that saw more than 25 percent of refining capacity shut down. Of the remaining capacity, nearly a third - at the Sunoco Philadelphia refinery is due to close in July. Why are East Coast refiners running for the exits? How will the region secure refined product supplies without refineries? In “Don’t Let The Sun Go Down On Me - East Coast Refining Part I”, we look at why crude economics aren’t working in the region and the impact that refinery closures will have on gasoline supplies.
By 2013, nearly 300Mb/d of incremental NGL supply will flow to Mont Belvieu from the burgeoning U.S. wet gas shale plays. Belvieu continues to dominate the NGL universe because of its critical location at the center of NGL gathering systems, product distribution pipelines and the Gulf Coast petrochemical feedstock market. Is this hub big enough to handle the huge production growth? Who stands to benefit from all of the infrastructure expansion? In Part I of our series on Mont Belvieu titled Can Mont Belvieu Handle the NGL Supply Surge? we’ll examine this thing called Mont Belvieu and look at the “Big Four” Belvieu players to see how their assets dictate trading terms at the hub.
Bakken crude oil has traded at an $8-$10/Bbl discount to WTI for the past few weeks, and a few times since January this year has blown out to more than $20/Bbl. We talked about some of the reasons for this volatility in the first two installments of “The Bakken Buck Starts Here”, covering the mysteries of crude postings and pipeline hub pricing. Ultimately however refiners are more concerned with delivered crude oil prices. Today’s installment of The Bakken Buck Starts Here – Bakken Crude Pricing Part III compares delivered crude costs to four US refining centers.

On Wednesday of last week, Conway ethane dropped to 4 cnts/gal, another multi-decade low for any natural gas liquid and an 86% decline in the ethane price since the first of the year. But Conway ethane is not the only NGL that has been suffering. As shown in the graph below, ethane propane and natural gasoline are all off hard as high propane inventories combined with a $20/bbl decline in the price of crude oil rippled through NGL markets. What do changes in the prices of these NGLs mean for the relative value of each NGL as a petrochemical feedstock? Could we see natural gasoline start competing against ethane and propane? To answer these questions and to understand how natural gasoline petrochemical feedstock economics compare to ethane and propane numbers, we’ll dive one last time into our petchem spreadsheets.
Natural gas futures surged over 12 percent on Thursday to close at $2.49/MMbtu following an unexpectedly bullish EIA storage report. Analysts interpreted the storage numbers as evidence that coal to gas switching in the power market has not yet reversed as we enter the summer peaking season. The next market report to hit trader’s desks after the EIA storage numbers is the Commodity Futures Trading Commission (CFTC) Commitment of Traders (COT) analysis released later today (Friday). In today’s blog “The Long and Short of It – COT Reporting” Sandy Fielden takes a deeper look at the value of the COT report.

Subtitle: Rupture in the Space-Time Continuum
Yesterday the highest and lowest natural gas prices in the country were only 100 miles apart - on the same pipeline. Weird stuff like this happens in the middle of winter, but not in late spring. The pipe is Kinder Morgan’s Tennessee Pipeline, a.k.a, TGP. The lowest price in the country based on ICE next day cash market trading was TGP-Zone 4 Marcellus, averaging $1.65/MMbtu for the day. The highest price was just 100 miles east in TGP Zone 6 at $2.56/MMbtu. In today’s world of tiny natural gas basis differentials (Honey, I Shrunk the Basis), this is an incredible shoulder-season differential of more than $0.90/MMbtu. What could cause such a rupture in the space-time continuum? How long will the situation continue? Why does this development portend dramatic, long-term changes in natural gas flows across North America? Of course, the culprit is the Marcellus, where production is still roaring regardless of low gas prices. Today we’ll look at the impact of all this new production just a hop, skip and jump away from the biggest natural gas markets in the country.