The coal to gas switching debate has been raging for months. How much is happening? How long will it last? Could switching continue to increase? Will the generators save the producers from themselves? So far this year, that latter assertion seems to be the case. Additions to natural gas power burn by electric generators have been about the only thing propping up natural gas prices. If the generators weren’t burning so much gas, the storage surplus would be through the roof. Last week EIA announced that natural gas matched coal’s share of U.S. generation for the first time in April. That’s a big deal. In today’s blog “Talkin bout My Generation – Coal to Gas Switching Part I” we uncover the drivers behind the shift to natural gas generation, and set the stage for a deep dive into the longer term implications for gas markets.
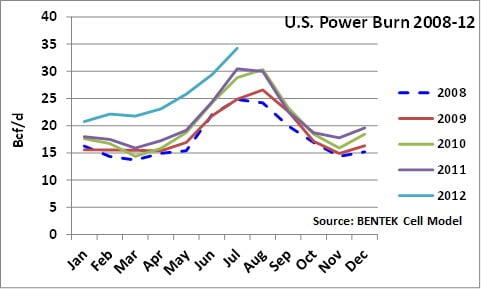
First, let’s look at the power burn numbers. The graph below tracks gas burned for power generation over the past five years, based on numbers from the Bentek cell model. Back in 2008, power burn never got higher than 25 Bcf/d on an average monthly basis. Prices dropped in 2009 and that was the first year of coal-to-gas switching, with most of the increases coming in the spring and late summer. In 2010 power burn was way up, but paradoxically coal to gas switching was down. We’ll get back to that in the paragraphs below. Last year power burn was about the same as 2010. Then starting in January of this year, gas prices dropped below $3.00/MMbtu and power burn kicked into high gear. It has been there ever since.
So let’s get back to the coal-to-gas switching phenomenon. We’ll begin our examination by addressing two questions. First is there adequate generation capacity out there to allow more switching from coal to natural gas? Second if there is adequate switching capacity, what are the constraints keeping more coal to gas switching from happening? For those not conversant with the nuances of generation unit dispatch, we’ll need to cover some of the basics of power generation economics, so put on your hard hats and hold tight.
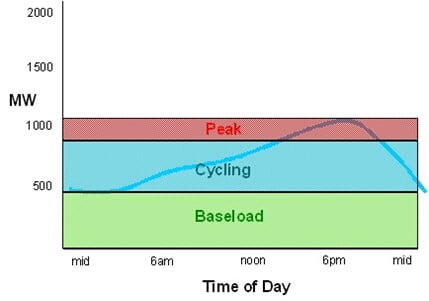
We need to get some terminology defined while we are still fresh to the topic – starting with the daily load or demand curve. The load curve (see the blue line on the chart below) indicates how much electricity is being used at any hour of the day. As you can see from the chart, the load curve passes through three distinct types of generation capacity – baseload, cycling and peak. By baseload capacity we mean the generation capacity that is run around the clock to meet the regular daily demand at the off peak level. On top of baseload capacity is intermediate or cycling capacity that ramps up and down during the day as demand fluctuates. Finally there is peak capacity that only gets used during the peak demand hours (usually late afternoon / early evening), and sometimes is not used at all.
Next we need to understand the Law of the Generation Stack. The Law of the Generation Stack states that generation is brought on line in order of the variable cost of operating the plant (although there are other factors – notably reliability - that have to be taken into account). Least expensive units first and most expensive units last – a process known as economic dispatch. Note that this is VARIABLE cost, not total cost. The Law of the Generation Stack ignores FIXED costs. So even though a nuclear plant costs a zillion dollars, the variable cost of running a nuclear plant is low.