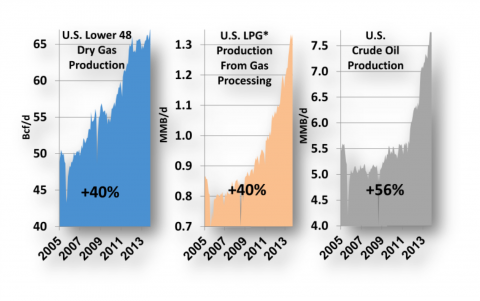
Natural gas production in the Lower 48 has surged 40 percent since 2005 – hitting record levels in recent months in spite of low prices and a drilling migration away from dry gas to liquids plays. Following a similar trajectory, natural gas liquids (NGLs) output from gas processing plants jumped 40 percent since 2009 as drilling for wet (high BTU) gas accelerated. Crude oil production from shale did not take off until the end of 2011 but since then has surged an astronomical 56 percent to 7.8 MMb/d. While this winter’s harsh weather has placed a temporary slow down on these skyrocketing production numbers, RBN fully expects the growth trend to continue - putting the U.S. within sight of energy independence in the not too distant future. Along the way plenty of new opportunities for the industry will be tempered by market challenges. Today we preview RBN’s latest Drill Down Report.
If there is any uncertainty remaining about how much energy markets have changed over the past nine years, the three graphs in Figure 1 below should put it to bed once and for all. Production statistics for U.S. natural gas, natural gas liquids and crude oil are all surging, in some cases into uncharted territory, in others back to levels last seen when President George H. W. Bush was President. Make no mistake about it. The U.S. is at the doorstep of that long sought-after goal of energy independence – where the country can produce all the energy that it uses. That goal may still be a few years away, but it is in sight. And for the U.S. consumer, that is a future so bright, you gotta wear shades.
Figure 1
Source: Energy Information Administration, RBN Energy (Click to Enlarge) [*LPG = propane, butane]
The first graph on the left shows natural gas production in the Lower 48 since 2005. Production has increased about 18 Bcf/d over that period, or about 40%. That’s a big increase, and it is even more impressive if you consider that the total worldwide market for natural gas exports or liquefied natural gas (LNG) is about 35 Bcf/d. So over the past few years, U.S. natural gas has increased by the equivalent of half of the world LNG market.
The middle graph shows liquid petroleum gas (LPG) production – propane and butanes, the fastest growing members of the NGL family. Compared to natural gas, LPGs took a little longer to kick into high gear, but when they did the increase was similar to natural gas, up 40% over the period since 2009 to 1.3 MMb/d. That is equal to about half of the total imports of LPGs by the world’s biggest importers in the combined Asia/Pacific and Indian Subcontinent regions.
And then there is crude oil. Between 2005 and 2010 while gas and NGL production was ramping up, crude seemed to be languishing – at least from the perspective of total U.S. statistics. But since 2011 crude production has shot up like a skyrocket - returning to levels last seen in March 1991. Crude production volumes are up 56% from about 5 Mb/d in 2009 to 7.8 Mb/d in late 2013.
|
|
RBN’s new Drill Down Report and the subject of this blog is titled -The Future’s So Bright I’ve Gotta Wear Shades – Crude, NGLs and Natural Gas Outlook. This and other Drill Down reports are available to RBN Backstage Pass Subscribers. A RBN Backstage Pass subscription gives you full access to RBN’s Drill-Down Reports, Blog Archive Access, Spotcheck Indicators, Market Fundamentals Webcasts, and Get-Togethers. More information on Backstage Pass here. |
These dramatic production increases in the past nine years have been characterized by triumphs of technology and productivity. But there have also been growing pains as the midstream industry struggled to deliver the new hydrocarbon bounty to market. During 2013 and the first part of 2014 the shale revolution passed through important stages of maturity as new or repurposed infrastructure came online to extract NGLs from natural gas and to deliver those NGLs, together with new crude production, to fractionation, petrochemical and refining centers on the Gulf Coast. Along the way we have seen a plethora of investment in infrastructure involving wholesale re-plumbing of the gas and liquids distribution system and the advent of significant crude-by-rail shipments to by-pass pipeline congestion or deliver to markets with no pipeline service on the East and West Coast.
And as new supplies have arrived at processing and refining centers the next phase of the revolution has begun as refiners and fractionators now seek new markets for surging production of NGLs and refined products from their plants. At the same time billion dollar plants to liquefy natural gas for export are being constructed – in many case on the same sites earmarked for LNG imports less than 10 years ago.
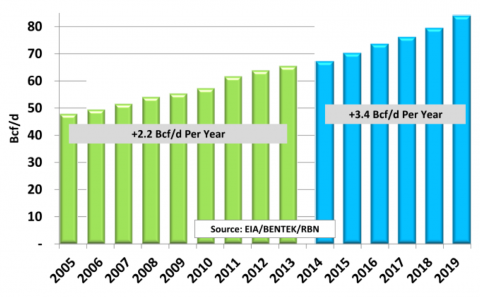
Natural gas is the most mature sector of the shale industry and yet as Figure 2 below shows production is expected to continue growing at 3.4 Bcf/d for each of the next six years - an even faster pace than the 2.2 Bcf/d seen since 2005. So although production is down temporarily due to weather related freeze-offs and other short-term problems this winter it will quickly recover to record levels in 2014 with higher prices encouraging more producers to drill for gas.
Figure 2 (Click to Enlarge)
Industry growing pains in the face of record natural gas production have been demonstrated by rapid storage depletion this winter. That challenge has been particularly evident in the Northeast where surging Marcellus/Utica production is not yet fully connected to demand centers and pockets of shortage have continued in areas like New England (see Please Come to Boston). Surging Marcellus production continues to impact traditional pipeline flows into the Northeast and many of those will be reversed – as far south as Florida (see Miami 2017). In the meantime the prospect of long term stable natural gas prices has prompted new demand for growing supplies in the form of natural gas power plants, industrial capacity or exports to Mexico and global LNG markets (see Golden Years – the Golden Age of US Natural Gas).
Join Backstage Pass to Read Full Article


