
The natural gas flow patterns that characterized the U.S. energy-delivery sector for the decades preceding the Shale Revolution are gradually being undone, and few, if any, states are more affected by these changes than Texas. The state remains the nation’s largest natural gas producer, and it still produces nearly twice as much gas as its consumes within its borders. But traditional Northeast and Midwest markets for Texas gas are being ceded to Marcellus/Utica producers, and more and more Northeast gas is flowing south/southwest to the western Gulf Coast, drawn by power/industrial demand, new LNG export terminals and rising pipeline-gas exports to Mexico. Today we begin a look at the dramatic shifts in gas flows out of Texas through key gas pipeline exit points.
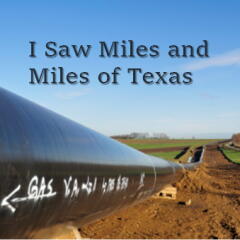
To get a sense of the impact the combination of increased Marcellus/Utica natural gas production, booming gas sales to Mexico, and rising LNG exports is having on the Lone Star State, look no further than changing flows on Texas’s network of interstate and intrastate pipelines. As we said recently in the third episode of our four-part Drill Down Report, “I Saw Miles and Miles of Texas,” Northeast gas production now averages about 22 Bcf/d (roughly as much as Texas and Louisiana combined) and is likely to continue rising under all but the most pessimistic price scenarios. Export demand—via LNG-laden ships to South America, Europe and Asia, and via pipelines to Mexico—is pulling increasing volumes of Marcellus/Utica gas south/southwest, and in the process is undoing historical gas flow patterns in Texas. These changing flow patterns also reflect the fact that Texas gas production is off about 10% (or 1.9 Bcf/d, to ~18 Bcf/d) so far in 2016 versus the same period last year, mostly due to output declines in the Eagle Ford, the Barnett Shale, the Gulf Coast region, and Texas’s part of the Granite Wash—declines that, taken together, far exceed production gains in the Permian Basin, the only part of the state that’s seen gas-output growth lately (see It Takes Two).

The NATGAS Appalachia weekly report provides the data and insights to monitor the northeast natural gas market’s twists and turns and identify the risks and opportunities along the way, including tracking supply-demand trends, outbound capacity and their impact on takeaway pipeline utilization, and regional prices.
Texas’s gas production still exceeds in-state demand by a considerable margin; demand by residential, commercial, industrial and power users within the state has averaged about 9.7 Bcf/d year to date, or about 54% of Texas production. Gas not needed to meet in-state demand has traditionally moved north, south, east and west out of Texas on the many interstate pipelines crossing its border to other parts of the U.S. and to Mexico. The five primary flow corridors/exit points for net flows out of the state are shown in the schematic below (Figure 1)—which, by the way, depicts interstate gas pipelines in blue and intrastate pipes in red. First there’s the historical flow from southeastern Texas into southern Louisiana and from there to markets in the eastern and southeastern U.S. (Exit Point A); next is the flow from northeastern Texas into northern Louisiana and then on to the Southeast, Midwest and Northeast (Exit Point B).

About the song
“The Times They Are a-Changin’” was written by Bob Dylan and appears as the first song on side one on Bob Dylan’s third studio album of the same name. Dylan wrote the song to be an anthem for change. It became a rallying cry for the civil rights and anti-war movement in the U.S. in the 1960s and remains a timeless classic song of strength for troubled times. It was released as a single in the U.K. in 1965, where it went to #9 in the U.K. Singles chart. Surprisingly, it was not released as a single in the U.S. The song has been covered by many artists, including Peter, Paul and Mary; Joan Baez, The Byrds, Bruce Springsteen, and Brandi Carlile. In December 2010, Dylan’s hand-written lyrics of the song sold at auction at Sotheby's in New York City for $422,500. Personnel on the record were: Bob Dylan (lead vocal, acoustic guitar, harmonica).
The album, The Times They Are a-Changin', was recorded between August and October 1963 at the Columbia 7th Ave. studio in New York City and produced by Tom Wilson. Released in February 1964 (days after The Beatles appeared on Ed Sullivan), it went to #20 on the Billboard 200 Albums chart and has been certified Gold by the Recording Industry Association of America. No singles were released from the LP in the U.S.
Bob Dylan is an American singer and songwriter. He has been an iconic international figure in popular culture for over six decades and has released 40 studio albums, 16 live albums, 31 compilation albums, seven soundtrack albums, 24 EPs, and 102 singles. He is a member of the Rock and Roll Hall of Fame and the Songwriters Hall of Fame and is a recipient of Kennedy Center Honors, a Presidential Medal of Freedom, a Polar Music Prize, France’s Legion d’Honneur, and a Nobel Prize in Literature. Dylan is also known for his paintings, drawings and books. His most recent book, “The Philosophy of Modern Song,” contains essays on 66 songs by artists who have influenced him. Dylan still records and tours and is appearing with Willie Nelson, Robert Plant and Alison Krauss at the Outlaw Music Festival Tour in the U.S., which began in late June 2024 and continues through September 2024. Dylan’s archives are housed at the Bob Dylan Center in Tulsa, which opened in May 2022.


Comments
Excellent article and use of graphics. It pulls in the entire picture.
Mark Thomas