Another round of big changes are coming to the markets for natural gas, natural gas liquids (NGLs) and crude oil. The surging production growth that has characterized these markets has slowed and in some basins is starting to fall as the mass exodus of drilling rigs begins to take its toll on shale production. But what about all that infrastructure that has been and continues to be built? Billions of dollars are going into pipelines, processing plants, petrochemical plants, terminals, storage, etc. based on a much higher production growth scenario than now seems likely. Where are the opportunities in this new energy market reality? The answer depends on a discernable pattern of events tied to production volumes, infrastructure capacity, commodity flows and project expenditures. Those are the themes of our latest State of the Energy Markets Conference scheduled for October 28, 2015 in Denver, CO as well as the subject of today’s blog – also an advertorial for the conference.

State of the Energy Markets, October 28, 2015
Hyatt Regencey Convention Center, Denver, Co
What is going on in today’s markets for natural gas, NGLs and crude oil, why it is happening, and what is likely to happen next?
More information about State of the Energy Markets here!
Before we get into the details of today’s blog, we need to let you know that the next RBN Fundamentals Webcast is scheduled for this coming Wednesday, September 23rd at 2:30pm central time. In this session available to Backstage Pass subscribers, Rusty Braziel will review RBN’s latest production forecasts, consider the consequences for pipeline projects and introduce a new RBN online database for monitoring infrastructure developments. This is the prequel not only for the State of Energy Markets in Denver, but also for some of the most important topics to be covered at RBN’s renowned School of Energy to be held a week from today in Houston, TX.

FUNDAMENTALS WEBCAST WEDNESDAY!!
RBN Energy's next Fundamentals Webcast for Backstage Pass subscribers has been scheduled for Wednesday, September 23rd at 2:30pm central time.
More information on Backstage Pass here.
Or to get information from Brenda, our events director, send an email to school@rbnenergy.com
Production Declines Are Finally Starting to Show Up
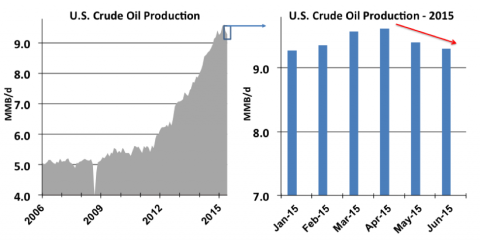
It had to happen eventually. There is only so much magic dust that U.S. producers can sprinkle on shale basins to counteract the impact of sustained low prices. After falling steadily from $100/Bbl plus last June to just over $40/Bbl in January 2015 and recovering to $60/Bbl between March and June of this year, U.S. benchmark West Texas Intermediate (WTI) crude prices have languished in the mid $40’s/Bbl this month (September 2015) and there seems to be nothing on the horizon that would make you think that even a return to the $60s is in the offing anytime soon. Low prices have prompted a dramatic pullback in drilling rig deployment and despite remarkable resilience in crude production, we have certainly witnessed a convincing end to the 1 MMb/d year growth experienced between 2012 and 2014 shown in the left graph in Figure #1.
Monthly Energy Information Administration (EIA) crude production data shows declines in May and June (red arrow on the right hand chart in Figure #1). It is reasonable to assume that downward trend will be with us for a while. Even the robust math of wells being completed out of inventory (wells drilled months ago, only now being brought online) and very high “sweet spot” initial production rates that have been mostly responsible for sustaining production until now can’t offset the natural declines in shale wells forever, at least not at today’s rig count.
Figure #1 – U.S. Crude Oil Production; Source: EIA (Click to Enlarge)
It’s a similar story for NGLs. Total NGLs from gas processing plateaued since January at 3.2 MMb/d this year, with May and June production below the peak month of April 2015. Lower-48 natural gas production has also been flat, with declines in most of the country supported only by strong production growth this year from Marcellus/Utica.
That slowdown has been a bit of a surprise for some midstream infrastructure developers. Take what has happened to developers of new pipeline capacity to the Gulf Coast over the past couple of years. As we covered in Stairway to Houston, new pipelines into Houston are – on average – running about half full today based on daily average flow rates from our friends at Genscape. As shown in Figure #2, when you stack up the seven major pipeline systems that move crude to the broader Gulf Coast market (Seaway, Seaway Twin, Enterprise Eagle Ford, Kinder Morgan Eagle Ford, Bridgetex, Longhorn and TransCanada MarketLink, capacity utilization looks a bit better recently, but still collectively those pipes are only about two-thirds utilized. Which begs the question, how many more pipes are really needed?
Join Backstage Pass to Read Full Article


