U.S. natural gas producers had a rough start to 2023, with spot prices dipping to just above $2.15/MMBtu this past spring. But optimism was abundant in midyear earnings calls on expectations that demand will eventually soar, driven largely by a near-doubling of U.S. LNG export capacity by the end of the decade. A key question, however, is whether E&Ps have built the inventories of proved reserves to support future production increases to meet that demand. In today’s RBN blog, we analyze the crucial issue of reserve replacement by the major U.S. Gas-Weighted E&Ps.
Before we began this four-part series, we asked, “How much longer can shale support U.S. oil and gas production?” In Say You’ll be There, we said that Energy Information Administration (EIA) estimates of proved reserves, which are assumed to have at least a 90% chance of eventual recovery under existing economic and operating conditions, imply about 10 years of remaining volumes of crude oil and condensate and 10-17 years of natural gas in the major producing basins. Critical to maintaining or expanding these inventories is the rate at which U.S. producers are replacing the reserves they produce. Equally important — especially in an era of heightened scrutiny over capital efficiency — is the price paid to achieve that replacement rate.
Join us at our historic 20th School of Energy!
School of Energy: Foundations is a two day, in person conference designed to help energy professionals better understand the forces shaping crude oil, natural gas, NGLs, refined products, and petrochemicals.
Attendees will learn from RBN experts, work with Excel based analytical models, participate in Q&As, and network with industry peers.
Build the foundation to better navigate volatile energy markets.
In the first episode of our series, we examined the overall reserve replacement metrics of the 41 top U.S. E&Ps we monitor. Using three-year average data, the most reliable method of analyzing long-term trends, we found that the reserve replacement rate bounced back from a major dip in 2020, when plunging prices resulted in major negative reserve revisions, to 200% in 2022. This doubling of the reserves added was accomplished at an average reserve replacement cost of just under $10/boe, compared with nearly $25/boe in 2016 and $15/boe in 2020. These results were achieved with a reinvestment rate (total cash flow divided by capital expenditures) of only 39%, a 10-year low. In Replace Me, Part 2, we revealed that the major U.S. Oil-Weighted producers were instrumental in driving that reserve replacement performance. The reserve replacement rate for the oil-focused group soared from 24% in 2020 to 357% in 2021 and 244% in 2022.
In Replace Me, Part 3, we turned our focus to the largest Diversified producers, which have more balanced portfolios weighted between 40%-70% for both oil and natural gas. The three-year reserve replacement rate for the group recovered from 133% in 2020 to 179% in 2021 and 177% in 2022 — rates well below the replacement rates generated by the Oil-Weighted producers. Dragging down the overall results were tepid replacement rates from finding and developing (F&D) activities. The Diversified peer group’s three-year replacement rate from organic activities plunged to 77% in 2020 and only slowly recovered to 91% in 2021 and 100% in 2022 — in other words, barely replacing output. Replacement costs did jump from $9.03/boe in 2019 to $13.76/boe in 2020 and over the next two years have settled at just below that level, the highest among the three groups of producers. Among the questions raised by this performance was whether the higher gas-weighting of their portfolios contributed to this underperformance, an issue we could address by examining the reserve replacement results of the Gas-Weighted producers.
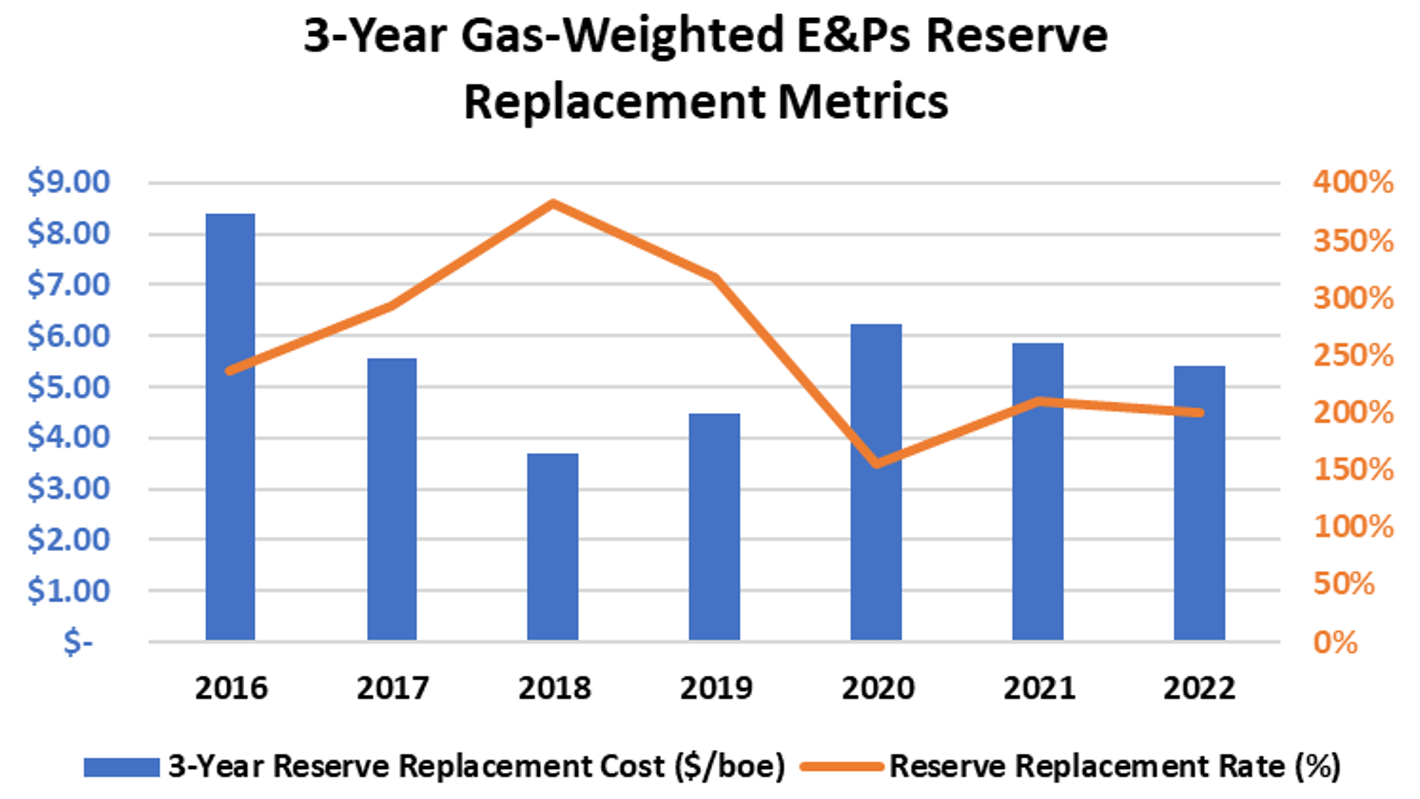
Figure 1. Gas-Weighted E&Ps’ 3-Year Reserve Replacement Metrics. Source: Oil & Gas Financial Analytics, LLC

About the song
“Replace Me” was written by Nas, Sean Anderson, Caleb Toliver, Hollis, Rashad Muhammad, Ella Mai, Varren Wade, Quinton Q. Gulledge and Dijon McFarlane. It appears as the sixth song on Nas’s 12th studio album, King’s Disease. The song features fellow rap artists Don Toliver and Big Sean appearing with Nas. Released as a single in August 2020, it went to #49 on the Billboard R&B/Hip-Hop Songs Singles chart. A video directed by Christian Sutton and featuring Nas, Don Tolliver, Big Sean and Hit-Boy was released to support the single. Personnel on the record were: Nas, Don Toliver and Big Sean (vocals), MonoNeon (bass, sampling, programming), and Hit-Boy, Exit Goodchild and Gabriel Zardes (sampling, programming).
King’s Disease was recorded during early 2020 and produced by Hit-Boy, Gabriel Zardes, Audio Anthym, Corbett, Cyanca, G.Ry, Haze, J. Pelham, Pat Junior, Penthouse Parti and Roget Chahayed. Released in August 2020, the album went to #5 on the Billboard 200 Albums chart. The album won a Grammy Award for Best Rap Album at the 63rd Annual Grammy Awards. Three singles were released from the LP.
Nas (Nasir bin Olu Dara Jones) is an American rapper rooted in East Coast hip hop. He is the son of American jazz musician Olu Dara. Nas began his hip hop career in 1989, and released his debut album, Illmatic, in 1994. He has released 16 studio albums, five compilation albums, one EP and 79 singles. He has sold more than 35 million records worldwide. Nas has also appeared in a few films and television shows. He continues to record and tour.