In August 2011 there were 900 rigs drilling for natural gas in the U.S. As of last week 405 gas rigs had disappeared and only 495 were left. As we all know, when gas prices fell, so did the natural gas rig count as producers moved capital budget dollars and rig crews to crude oil. That shift resulted in an astronomical increase in the crude oil rig count - from 1,050 this time last year to 1,432 today (Chart #1). But somehow the decline in the natural gas rig count has not translated into a decline in natural gas production. Very Strange. With shale gas wellhead production decline rates up to 80% in the first year, how is it that gas production has remained flat? Ghostly. When Halloween comes this year the 2012 natural gas production trend line will fall below the 2011 trend. What will that mean? Today, the 13th of August, we’ll look into the numbers to see how these spooky trends are likely to play out over the next few months.
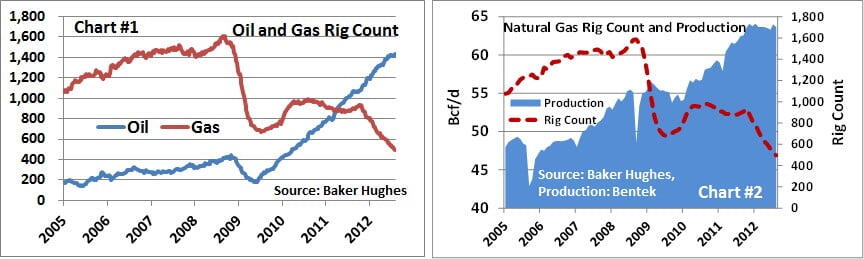
Natural Gas Rig Count and Production
There was a time not so long ago that the relationship between natural gas rig count and production was one of those sacrosanct rules-of-thumb. When market prices declined, producers cut back drilling and within the short span of a few months production would start to fall. Just like clockwork. But as Chart #2 clearly shows, that relationship broke down in mid-2008. Rig count fell hard during the financial bust and subsequent crash in energy prices. And for a while, production declined leading many to believe that the rule-of-thumb was intact. But the numbers were misleading. During 2009 it was true production from conventional wells was declining, but at the same time the shale revolution was kicking into high gear. The rigs still drilling were shifting rapidly to shale plays. And those rigs were bringing on huge quantities of natural gas. The only catch was that the infrastructure to process and move that gas to market was not able to keep pace with drilling. So wells were drilled but not completed or connected to pipelines. By 2010, midstream infrastructure caught up with drilling, and that is when gas production took off. It sprinted upward starting in early 2010, building up a surplus of supply. By the end of 2011 that surplus of supply combined with a mild winter to crush natural gas spot prices. As prices declined, the natural gas rig count headed south again, and that decline continues today.
Before we go on, just a word about drilling for crude oil. As producers shifted drilling budgets away from natural gas, the primary beneficiary was crude oil drilling. As noted above, the number of rigs drilling for crude oil has increased from 1,050 in mid-2011 to 1,432 today. The relationship between the crude oil rig count and production does seem to be holding, although we really won’t know for sure until the crude oil rig count starts to decline. Over the past few weeks the rate of growth in the crude oil rig count has slowed, and the most recent couple of months of EIA crude production data have been relatively flat. Most likely the slowdown (if real) is attributable to infrastructure constraints that will be resolved in the very near future.
Natural Gas Producer Rig Productivity
So back to natural gas. Why has the decline in the natural gas rig count not translated into a decline in natural gas production? There are several reasons why, but probably the most compelling reason is a step-function increase in rig productivity. There are a number of ways to demonstrate this phenomenon, and Bentek has a data series and report that tracks a standardized rig count number called the BPI, or Bentek Productivity Index. But one of my favorites is to use the results of a specific company in a specific play – in particular, Southwestern Energy’s results in the Fayetteville. Why this particular play? First, because it is representative of the productivity improvements shown by many producers. And second, because Southwestern has been kind enough to produce a consistent series of statistics on their Fayetteville results since 2007. So it makes it easy to do the analysis.
Chart #3 lays out those productivity gains on an annual basis since 2007. The first block of bars shows that Southwestern’s drilling time declined from 17 days to drill a well in 2007 to only 8 days in 2011, a reduction of 53%. The next group of bars simply translates that metric into the number of wells that a single rig can drill each year by dividing 365 by the drill time. In 2007 one rig could drill 21 wells. In 2011 that number was up to 46. The next group of bars shows the increase in 30 day average initial production rate (IP) for wells drilled. That number showed significant increases in 2008 and 2009, followed by the last three years of relatively flat performance. Even though the big increases in the IP rate have tapered off (for a variety of reasons, possibly including decisions to choke back initial production to extend the life of the well), that initial improvement in 2008-09 has held steady. The last group of bars is simple math, showing the wells per year multiplied by the 30 day IP rate. In 2007, a single rig could generate 34.4 MB/d of new production (21 * 1.6). In 2011, a single rig could generate 150.6 Mb/d (46 * 3.3). That’s a 338% productivity improvement. And that is one of the most important reasons why natural gas production has remained flat while the rig count has dropped. For more information on these Southwestern Energy statistics, see page 23 of the investor presentation at the link below