After thoroughly alienating their investor base over more than two decades of boom-and-bust cycles, U.S. E&Ps won investors back in the early 2020s by radically transforming themselves from high-risk to high-yield vehicles. Fueled by surging crude oil and natural gas prices in 2022, producers generated massive free cash flows — and spectacular shareholder returns that topped 10% during the late-2022 peak. Prices and cash flows subsequently retreated, however, and skeptics worried about the sustainability of producers’ high-return strategy. Would debt repayment, dividends and share buybacks sink? In today’s RBN blog, we‘ll review the Q1 2024 cash allocation of the major U.S. E&Ps with a spotlight on current dividend yields.
First, let’s quickly review how far the E&P sector has come. The S&P E&P Index — formally known as the S&P Oil & Gas Exploration & Production Select Industry Index — retreated from its peak of over 12,000 in mid-2014 to between 4,000 and 6,000 for most of the 2015-19 period and plunged to a low of just 1,224 in March 2020. However, after seven years of negative returns, the shift to a shareholder focus in the wake of COVID resulted in a near doubling of that index through the balance of 2020 and 67% and 46% total returns in 2021 and 2022, respectively, that helped quadruple the index to the 5,500 range. The index remains there today, despite a decline in cash flows that resulted in a very modest 3.8% return in 2023. And, as we recently outlined in Devil’s in the Details, Q1 2024 earnings stabilized at a historically solid level. But what about shareholder returns and dividend yields?
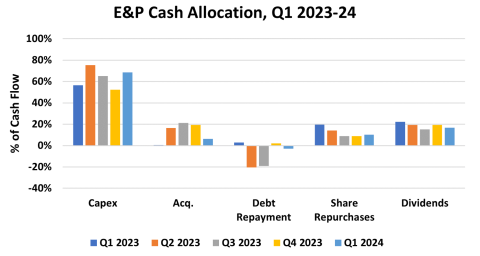
The 42 U.S. E&Ps we cover generated a combined $27.3 billion in cash flow from operating activities (CFOA) during Q1 2024, down 16% from Q4 2023 and 14% less than the $31.9 billion generated in Q1 2023. But capital outlays rose to $18.7 billion in the first three months of 2024 — 10% higher than Q4 2024 and 4% more than Q1 2023. As shown in Figure 1 below, the capital spending and CFOA data yielded a 68% reinvestment rate during Q1 2024 (light-blue bar in Capex grouping to far left), higher than the 52% recorded in Q4 2023 (gold bar) and 57% in Q1 2023 (dark-blue bar). Lower CFOA and higher capex resulted in a 45% drop in free cash flow (FCF) to $8.6 billion in Q1 2024, 45% below the $15.6 billion reported in Q4 2024 and 38% below the $13.8 billion recorded in Q1 2023. Acquisition spending (second grouping in chart) was $1.7 billion in Q1 2024 — or only 6% of E&P cash allocation (light-blue bar) — nearly three quarters less than the $6.3 billion reported in Q4 2023. As we mentioned recently in Like a Rock, while E&P balance sheets remain strong, debt repayment (third grouping) on a mass scale has ended. To that end, debt increased by $859 million in Q1 2024, compared with a $710 reduction in Q4 2023 and a $918 million reduction in Q1 2023.
Figure 1. E&P Cash Allocation, Q1 2023-24. Source: Oil & Gas Financial Analytics, LLC
Join Backstage Pass to Read Full Article


