A macro view of U.S. exploration and production (E&P) company performance over the last quarter century reveals repetitive boom-and-bust cycles driven by periodic extremes in crude oil pricing, including price crashes in 2008, 2014 and 2020. That history contrasts with the remarkable stability in West Texas Intermediate (WTI) realizations since mid-2021 as the industry got its footing post-pandemic. Assisted by a new commitment to financial discipline, producers have generated relatively stable, historically solid overall quarterly earnings and cash flows. But the devil’s in the details, and in today’s RBN blog we delve into peer group and individual company performance as well as overall industry trends for Q1 2024.
Recovering from a pandemic low of $16.55/bbl in April 2020, the monthly-average WTI oil price once again topped $70/bbl by June 2021 and has stayed above that mark ever since. Sometimes well above: Prices exceeded $100/bbl for five months in early 2022 before retreating but have generally hovered in the $75-$85/bbl range. As a result, every E&P in our Oil-Weighted and Diversified peer groups has reported a net pre-tax operating profit since Q2 2021. While earnings peaked in 2022, returns have been sufficient for producers to subsequently reward shareholders with substantial returns in the form of dividends and share buybacks (see If You’ve Got the Money, Honey). Gas-focused producers have not been so fortunate. Our Gas-Weighted peer group reported steady profitability as the Henry Hub average monthly price climbed above $4/MMBtu in September 2021 and peaked above $8/MMBtu a year later. But a price plunge to near $2/MMBtu in early 2023 financially crippled results, although most of the gas-focused producers we monitor remained in the black thanks to a combo of belt-tightening and production cutbacks.
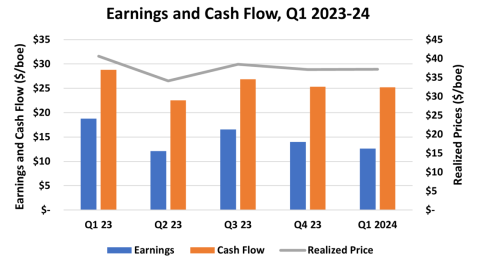
As shown in Figure 1 below, average realizations (gray line and right axis) across our universe of 43 E&Ps have been relatively stable for the last five quarters, with the exception of a dip in Q2 2023, resulting in net pre-tax operating profits and cash flows in a relatively stable range. However, results are beginning to vary significantly among producers in each of our three peer groups. Let’s take a look at the overall data before dipping into individual company results. For all 43 of the companies we cover, earnings amounted to $17.4 billion in Q1 2024, 8% below Q4 2023 and 27% lower than Q1 2023. Their cash flow (orange bars and left axis) was $25.21/boe in Q1 2024, down 2% from Q4 2023 and 5% below a year ago. Earnings (blue bars and left axis) were $12.64/boe in Q1 2024, 4% below Q4 2023 and 33% below Q1 2023. Per-unit cash flow increased 2% over Q4 2023 to $25.21/boe but declined 12% versus Q1 2023. Oil and gas production for the all-encompassing group was 1.419 billion boe in Q1 2024, down 4% versus Q4 2023 but up 9% from one year ago.
Figure 1. E&P Earnings and Cash Flow, Q1 2023-24.
Source: Oil & Gas Financial Analytics, LLC
Join Backstage Pass to Read Full Article


