Global natural gas prices went through the roof in December, and while prices are back down from those highs, they remain incredibly strong compared to years past and the economics for U.S. LNG exports are riding high. LNG exports have been in the money for quite some time, but feedgas deliveries to U.S. export terminals throughout the spring and summer of 2021 were somewhat lackluster as maintenance and operational issues at terminals and nearby pipelines kept feedgas from hitting its full potential. Gas deliveries to those terminals began climbing in the fall, first back to full utilization levels, and then beyond. Much of the record feedgas demand has been from commissioning activity at Sabine Pass Train 6, which produced its first LNG in December and is on track to begin full service early this year. But beyond that, operators have been pushing the existing fleet of terminals to operate at peak levels and produce additional cargoes, likely for sale in the spot market or on short-term contract, an extremely profitable endeavor given the prices in Europe, where most if not all destination-flexible cargoes have headed. In today’s RBN blog, we look at what’s driving LNG feedgas demand to its recent highs and how much higher it could go.
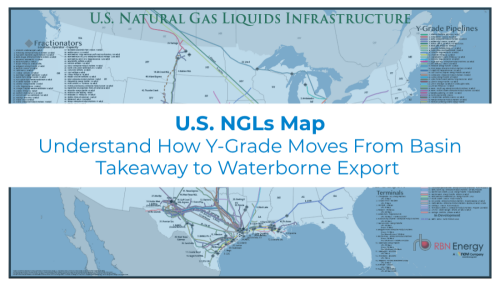
Visualize the infrastructure behind U.S. NGL movement.
The U.S. NGLs Map provides a comprehensive view of the transport, processing, and export networks moving NGLs across the U.S.
Although prices in Europe and Asia are down from their recent highs in late December (see Baby, It’s Cold Outside), they remain very strong. Global gas prices repeatedly set new records throughout the past six months, with the Japan Korea Marker (JKM), representing Asia, and the Dutch Title Transfer Facility (TTF), representing Europe, both averaging nearly $40/MMBtu in December, with TTF spiking to near $60/MMBtu last month. Prior to last summer the highest single-day settlement of either market was just $19.70/MMBtu, which JKM hit in January 2021. Even after a massive fall-off to end the year, prices are still well above that year-ago level. All of that is to say that the economics for exporting LNG from the U.S. look phenomenal and have for some time.
Our LNG Voyager report tracks U.S. exports weekly and Figure 1 summarizes those economics for the past year and in the mid-term, based on the current forward curves. Specifically, the graphs show the JKM and TTF price indices vs. RBN’s estimate of marginal and fixed costs to deliver to Asia (left graph) and Europe (right graph). We discussed the various components that make up these costs and how they are calculated at great length in our Sultans of Swing blog series and in Wild Thing. When we show this graph, we typically include just the marginal cost ranges (shown in light blue for deliveries to Asia and light orange for deliveries to Europe), because as long as JKM and TTF (black lines) are above those ranges, contracted U.S. exports from existing terminals are profitable and economic cancellations are unlikely. But global gas prices are so high right now that it makes sense to layer in the fixed costs (dark blue for Asia, dark orange for Europe) because the price spread between the U.S. and the end regions easily clears the full-cycle cost for producing LNG. Looking at this over the past year gives a clear picture as to why the U.S. is likely to see multiple new LNG projects reach a final investment decision (FID) in 2022 (see The Race is On) and why many of the existing U.S. terminals are producing above their contracted capacity, driving feedgas demand above typical full utilization rates.
About the song
“(Your Love Keeps Lifting Me) Higher and Higher” was written by Gary Jackson and Carl Smith. It was recorded at Columbia Studio in Chicago in June 1967, with Jackie Wilson's vocals being recorded in a single take. The Carl Davis produced record was released as a single by Wilson in August 1967 and went to #1 on the Billboard R&B and #6 on the Hot 100 charts. The song was inducted into the Grammy Hall of Fame in 1999. It has been covered by several artists, with Rita Coolidge scoring a #2 on the Hot 100 in 1977. Bruce Springsteen and the E Street Band frequently use it in their live shows. A Jackie Wilson album titled Higher and Higher was released in November 1967 featuring the hit song. The album went to #26 on the Billboard R&B chart and #163 on the Billboard Top 200 Albums chart. Personnel on the record were: Jackie Wilson (lead vocals), James Jamerson (bass), Richard Allen, Maurice White (drums), Robert White (guitar), Johnny Griffith (keyboards), and The Andantes and Pat Lewis (background vocals).
Jackie Wilson (Jack Leroy Wilson Jr.) was an American soul singer and showman from Detroit. He was a tenor with a four-octave range. His voice and wild stage moves earned him the nickname “Mr. Excitement.” He released 25 studio albums, one live album, 10 compilation albums, and 78 singles. Wilson is a member of the Rock and Roll Hall of Fame, R&B Music Hall of Fame, and Michigan Rock and Roll Legends Hall of Fame. In September 1975, Wilson suffered a major heart attack on stage while singing his hit “Lonely Teardrops” at a Dick Clark rock and roll revue show. Lack of oxygen to the brain left him incapacitated and put in full-time care at the Medford Leas Retirement Center in Medford, NJ. Wilson died there in January 1984 at the age of 49. Motown founder Barry Gordy has stated that Wilson was “the greatest singer I've ever heard.”