It’s been an incredibly wild year for U.S. LNG exports. In the past year, global gas prices have seen both historic lows and highs, as markets swung from extreme demand destruction from COVID-19 for much of last year, to supply shortages by late 2020 and into early 2021 due to maintenance outages, weather events, Panama Canal delays, and vessel shortages. The U.S. natural gas market has also dealt with its share of anomalies, from a historic hurricane season in 2020 to the extreme cold weather event last month that briefly triggered a severe gas shortage in the U.S. Midcontinent and Texas and left millions of people without power for more than a week. Given these events, U.S. LNG feedgas demand and export trends have run the gamut, from experiencing massive cargo cancellations and low utilization rates to recording new highs. Throughout this incredibly tumultuous year, U.S. LNG operators have had to adjust, managing the good times and bad and proving operational flexibility in ways that will serve them for years to come. Here at RBN we track and report on all things LNG in our LNG Voyager report, and we’ve been hard at work enhancing and expanding our coverage to capture the rapidly evolving global and domestic factors affecting the U.S. LNG export market, including terminal operations, marginal costs and export economics, and international supply-demand fundamentals. Today, we highlight how U.S. LNG has changed in the past year and trends to watch this spring. Warning! Today’s blog is a blatant advertorial for our revamped LNG Voyager Report.
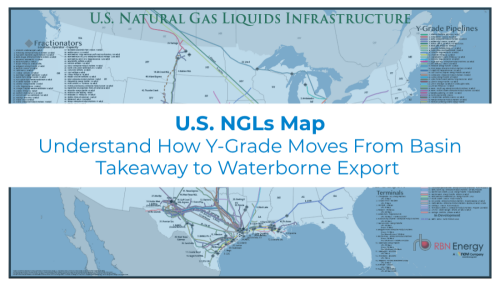
Visualize the infrastructure behind U.S. NGL movement.
The U.S. NGLs Map provides a comprehensive view of the transport, processing, and export networks moving NGLs across the U.S.
To fully grasp just how much the U.S. LNG export market has changed in the past year, we have to go back about one year to March 2020, before the pandemic effects had set in. It may be hard to imagine those pre-COVID days now, so allow us to set the stage. The U.S. had just finished adding 25 MMtpa (3.34 Bcf/d) of liquefaction and export capacity over the course of 2019 and early 2020. Feedgas deliveries and LNG exports during this period were predictable for the most part, ramping up as the liquefaction trains were completed and then consistently operating near full utilization of capacity as the units were brought online and commercial contracts kicked in. So, in March of last year, feedgas demand was near what were then record highs, with little indication of volatility outside of routine maintenance events. It seemed like all LNG could do was grow — which was a story LNG developers were happy to promote.
Then COVID-19 hit, decimating global demand, sending global gas prices to all-time lows and turning the economics for exporting U.S. LNG upside down for the first time since early 2016 when the first train at Cheniere Energy’s Sabine Pass terminal began exporting. We discussed the unraveling of the U.S. LNG export market that followed in a number of blogs last spring and summer, including Break It to Me Gently, Undone and LNG Interruption. The upshot is that offtakers of U.S. LNG began cancelling cargoes and, by summer, feedgas demand plummeted (dashed blue oval in Figure 1). Feedgas deliveries in July and August averaged just 3.66 Bcf/d, or about 40% of where they were in the first quarter of 2020 and just 42% of capacity at the time. Cancellations lessened by late summer as pandemic lockdowns eased, first in Asia and later Europe, and global prices improved. But just as U.S. LNG exports were poised to begin a recovery, a record-setting hurricane season wreaked havoc on the operations of Gulf Coast LNG terminals, particularly in Louisiana (see You Spin Me Round). Throughout the fall, nearly every U.S. LNG terminal faced some kind of outage, port closure, or shut-in for maintenance.
About the song
"Wild Thing" was written by Chip Taylor and appears as the first cut on side one of The Troggs’ 1966 debut album of the same name. The album was called From Nowhere in the UK and contained alternate tracks from the US version. "Wild Thing" was recorded at Olympic Sound in London, with Larry Page producing. Released in April 1966, it went to #1 on the Billboard Hot 100 Singles chart. It has been certified Gold by the Recording Industry Association of America. Because of a distribution dispute, the single was released on two competing labels: Fontana and Atco. Billboard combined sales from both labels, giving it the distinction of being the only #1 single for two different record companies. Chip Taylor's original demo of the song featured a solo in the middle section using a whistle. In The Troggs’ version, singer Reg Presley used an ocarina. Other artists have covered the song, the most famous being Jimi Hendrix. Hendrix used it as his set closer at his American debut at the Monterey Pop Festival in 1967. He finished the song by setting his guitar on fire, smashing it to pieces, and throwing the remains to the audience. Personnel on the record were: Reg Presley (lead vocals, ocarina), Chris Britton (guitar, backing vocals), Pete Staples (bass, backing vocals), and Ronnie Bond (drums).
The Wild Thing album was released in the U.S. in July 1966. The Larry Page-produced album had two singles released from it.
The Troggs (originally called The Troglodytes) are an English rock band formed in Andover, Hampshire in May 1964. They released five studio albums, two live albums, 12 compilation albums, and 37 singles. Fourteen members have passed through The Troggs since their formation. Original drummer Ronnie Bond died in 1992 and singer Reg Presley in 2013. A current version of the band, led by original guitarist Chris Britton, still tours occasionally.