The golden years of natural gas abundance in which we find ourselves are sparking tremendous enthusiasm among potential users of the fuel, from power generators to major industrial companies, to exporters both current and potential. After all, a trifecta of cheap, abundant, and clean is hard to resist. But the big question is how supply and demand really shake out after everyone’s enthusiasm results in new and growing use of the resource. Is the natural gas industry going to be able to supply all the new demand without prices going up the way they have in the past, most recently hitting double-digits at Henry Hub just five years ago? The first step in order to weigh supply against demand is to have a plausible scenario of what that demand might be. What does it all add up to? So in today’s blog we will see how much demand we should be trying to meet, to be followed later by a next installment to see how producers might meet it.
In “Golden Years: The Golden Age of U.S. Natural Gas,” we began an analysis of the questions raised in the earlier series, "Industrials Say, 'I'm A Believer'"—specifically, the concerns voiced by some in the industrial community as to whether the natural gas renaissance is real and sustainable, with plenty of natural gas at reasonable prices. That first installment reviewed the tortured history of the industry, 50 years’ worth of government missteps in regulation, with a hangover of supply-demand imbalance caused by technological limitations. Then we covered the massive and permanent change in the industry brought about by the twin breakthroughs of a government structure that works and the huge, game-changing impact of the shale revolution. But we left it there—plenty of gas, with an industry free to find it and consumers free to use it, but with some overarching questions still to resolve. Those basic questions simply go to the industry’s real ability to serve rapidly growing natural gas demand, smoothly and at reasonable and stable prices.
This examination has to start from a determination of what kind of demand we think may evolve for the U.S. natural gas industry. It’s only after we see what the supply side may need to respond to that we can draw valid conclusions as to the supply side’s ability to do so.
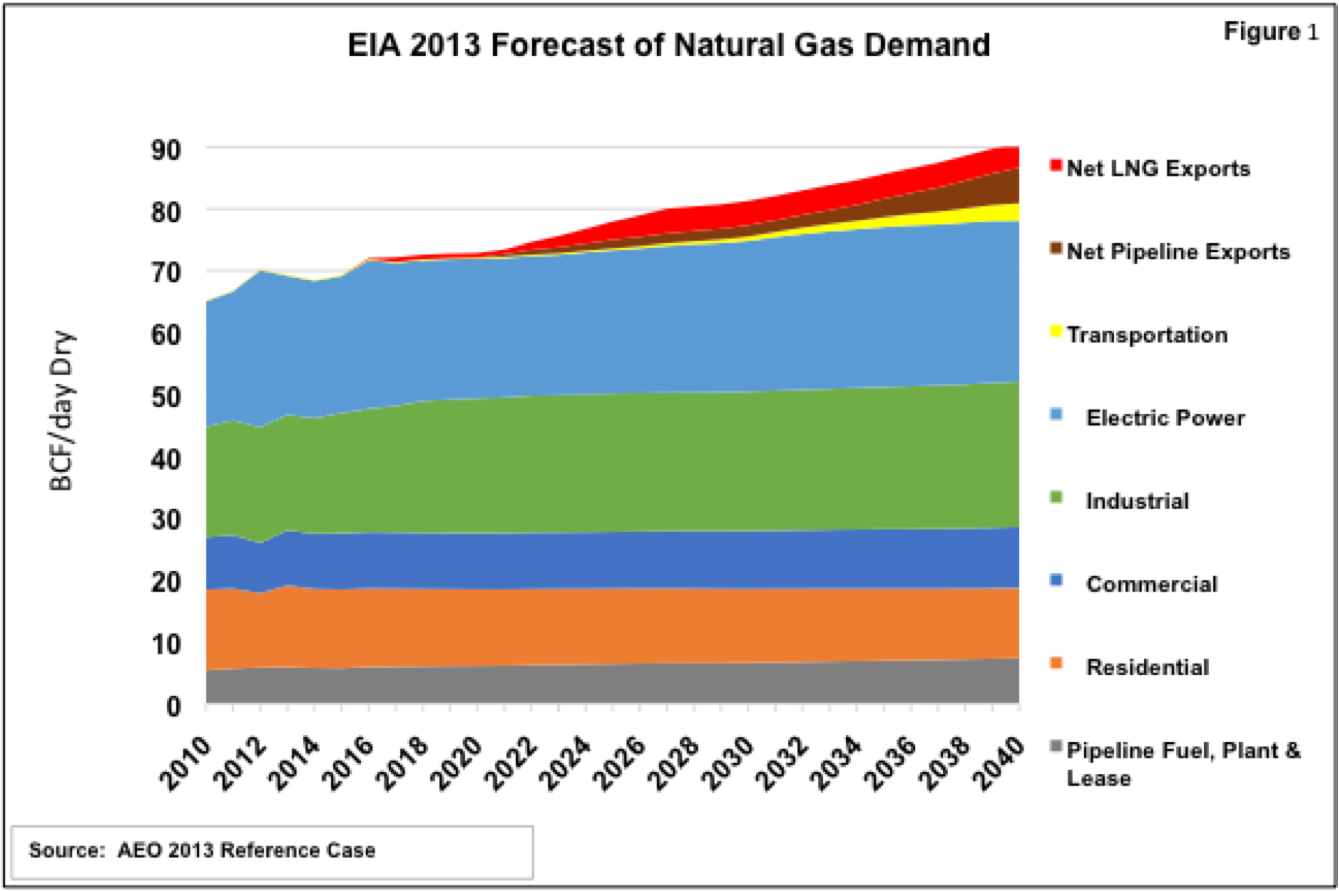
The Energy Information Administration (EIA) already has some pretty healthy growth in demand in its latest Annual Energy Outlook, AEO2013. Figure 1 charts the EIA demand forecast (converted from annual to daily) for all uses, growing from about 65 Bcf per day to 90 Bcf per day by 2040. The reason to start with EIA’s forecast is that this is the estimate that balanced with the supply EIA thinks can come forth at reasonable, stable prices.
Working up from the bottom in Figure 1, we have three small and uneventful sectors: Pipeline, plant, and lease use (gray), residential orange), and commercial (dark blue). Although most people think of utilities (the local gas company) when we mention natural gas, by the time we get to the top of the commercial block, these three sectors amount to only 41 percent of demand in the early years, declining to 32 percent by the end of the EIA study, The growth comes from the big three: industrial use (green), power generation (light blue), and exports (brown for pipelines and red for LNG). There’s also a tiny sliver in there for transportation (yellow).
This overall EIA growth profile is substantial (after all, growth from 65 to 90 Bcf per day is 38 percent), but it’s over a period of 30 years. That’s a one-percent compound annual rate of growth. So big end-users such as industrial companies building new plants and power generators turning to gas understandably ask what happens if actual demand turns out to be higher than EIA’s forecasts. After all, with all the good things happening in the gas market it could turn out to be a lot higher.
So let’s consider one plausible scenario of higher demand. In doing so, we will focus on the mid-2020s, rather than trying to guess what will happen by 2040. The mid 2020s more or less hit the midpoint in the life of big capital investments being made now, and are well after the inception of large changes such as LNG exports. Going much further out than that seems a little silly in an industry that has to work pretty hard to figure out what will happen on Tuesday.
Gas Rules the Generation World?
We concentrate on the big three, power generation, industrial use, and exports, since they have the most potential to “move the needle” of the supply-demand balance. Let’s start with power generation—it is happening now, and it is large. Changes like environmentally driven coal retirements and low gas prices have put power at the head of the list for short-term demand growth.
There is already a huge gas-fired fleet out there—almost 40 percent of all generation capacity (vs. 30 for coal), and from 1990 until now, gas has dominated new-plant construction—71 percent of the total, 84 percent of the non-wind/non-solar construction. But capacity is only part of the answer—we need to know how much the gas-fired generation will actually run, to know how much gas it will need. Figure 2 lays out EIA’s guess, extracted from the total-demand estimate in Figure 1 (the blue curve). See the Mount-Everest-style spike in 2012? That was the result of last year’s bargain-basement prices, which simply caused existing gas-fired generation to run a lot more than coal. In April of 2012, the natural gas market share of power generation actually equaled that of coal, for the first time in history. This victory didn’t last very long—one month, in fact—then as prices recovered from the impact of one of the warmest winters in history, coal climbed back and gas dropped. (One sidebar lesson to be learned from the 2012 experience is that gas-fired generation makes a dandy market governor, responding to low prices by turning up and to high prices by turning down). Still, generation for the year came out above 25 Bcf per day, an all-time high. As you can see from Figure 2, EIA is saying gas-fired generation won’t reach that level again sustainably for over a decade—in fact, while not shown on Figure 2, the forecast barely claws its way back to the 2012 level by the end of the study period, in 2040. That sounds just a trifle conservative. So how much additional demand is it reasonable to assume on top of EIA’s estimate, by the mid-2020s?


Comments
What an excellent article.
Do you see any chance of economics driving coal plant retirements? (In other words, not just new environmental requirements.) Article in WSJ about it in NE recently, but I recall earlier "My Generation" series indicating at the time that its selected coal price equalized out with natural gas at $3.10 per MMBTU. My guess would be that coal would have some more operational expenses, fly ash, etc.
Thank you.
http://online.wsj.com/news/articles/SB10001424052702304281004579222571211857870?KEYWORDS=coal+%22natural+gas%22
Hey, Time on Target--Great questions from both posts. Second one first: It's more questions than I'm going to try to answer here, but the competitive balance is semi-bright for gas even without bargain-basement 2012-type prices. Basically, at prices in the $3.50-$4.50 (delivered) range, gas combined-cycles are competitive with eastern coal. Depends on power grid needs, of course, and specific location, but the high efficiency of combined-cycle plants overcomes a lot of Btu price difference. As we saw last year, there are two tiers--getting cheaper than eastern coal, then (as gas did briefly) getting competitve with Powder River Basin coal. But the second one takes two-buck kind of stuff, not a sustainable answer in terms of supply. First question second, coal plants vulnerable to retirement for pure economics without environmental drivers? Probably not, generally. However, we have seen instances where some of the units in a plant aren't economic to retrofit for environmental rules while some are, but the utilities have decided to retire the whole plant. I'd assume that's because the economics of the remaining units start to break down when they're not part of a larger whole, but that's a guess. It could just as well be strategic thinking on the part of the utility, anticipating further pressure. Overall, it's very hard to get to favorable economics to retire an old, depreciated coal plant if you'd have to turn around and replace it at $1,000 to $1,500 a KW for a new gas combined-cycle. Unless you're going to incur $1,000 a KW in retrofit costs on that old coal plant. Thanks for the comments.
In reply to Gas vs Coal by Rick Smead
Thanks Rick --
Great info. When you said "Overall, it's very hard to get to favorable economics to retire an old, depreciated coal plant if you'd have to turn around and replace it at $1,000 to $1,500 a KW for a new gas combined-cycle. Unless you're going to incur $1,000 a KW in retrofit costs on that old coal plant." I had one of those Homer Simpson moments "Do ah." It's not like there are many new coal plants around these days . . . .
Of course, if they already have the CC capacity built, that makes the prospects a bit better, it would seem . . . . But basically I'm now guessing that we aren't going to seem that much gas demand along these lines--other than the retirements that have already been commited to.