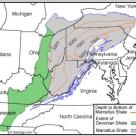
Just a couple of days after we talked here in Marcellus Changes Everything about the rupture in the space-time continuum’ between Tennessee pipeline’s Marcellus Zone 4 and the market area Zone 6, prices really blew out. Zone 6 traded last Wednesday at almost $8.50/MMbtu, responding to hot weather, nuclear outages and pipeline maintenance. Poor Marcellus actually fell to $0.88/MMbtu on Tuesday, before seeing some response to the blowout 100 miles down the road and getting to $1.75 on Thursday. But that only lasted as few hours. See our updated Zone 6 versus Zone 4 differential graph below. Why would we see such a blowout this time of year? Is this the kind of price behavior we can expect in the Northeast in the shale era? Today we’ll take a look at these questions and more related to Marcellus shale production and natural gas pipeline capacity in the Northeast.
Daily Energy Blog
Natural gas futures surged over 12 percent on Thursday to close at $2.49/MMbtu following an unexpectedly bullish EIA storage report. Analysts interpreted the storage numbers as evidence that coal to gas switching in the power market has not yet reversed as we enter the summer peaking season. The next market report to hit trader’s desks after the EIA storage numbers is the Commodity Futures Trading Commission (CFTC) Commitment of Traders (COT) analysis released later today (Friday). In today’s blog “The Long and Short of It – COT Reporting” Sandy Fielden takes a deeper look at the value of the COT report.

Subtitle: Rupture in the Space-Time Continuum
Yesterday the highest and lowest natural gas prices in the country were only 100 miles apart - on the same pipeline. Weird stuff like this happens in the middle of winter, but not in late spring. The pipe is Kinder Morgan’s Tennessee Pipeline, a.k.a, TGP. The lowest price in the country based on ICE next day cash market trading was TGP-Zone 4 Marcellus, averaging $1.65/MMbtu for the day. The highest price was just 100 miles east in TGP Zone 6 at $2.56/MMbtu. In today’s world of tiny natural gas basis differentials (Honey, I Shrunk the Basis), this is an incredible shoulder-season differential of more than $0.90/MMbtu. What could cause such a rupture in the space-time continuum? How long will the situation continue? Why does this development portend dramatic, long-term changes in natural gas flows across North America? Of course, the culprit is the Marcellus, where production is still roaring regardless of low gas prices. Today we’ll look at the impact of all this new production just a hop, skip and jump away from the biggest natural gas markets in the country.
With natural gas storage at record levels in early June, it looks like it’s going to be a long summer for gas producers hoping for better prices. The most important factor will be hot weather, or lack thereof. Temperatures this summer will have a significant impact on how much of that gas in storage is put to use for electric power generation. In today’s blog we’ll work through the degree day numbers and explain how a milder than usual summer could impact storage levels.

Yesterday natural gas NYMEX futures for July delivery closed at $2.421/MMbtu, down 2.5 cnts. Given where half of our RBN readers thought the market was going at the end of March (see Split Decision), this is a pretty good number. After bottoming out at $1.91/MMbtu, Natgas skyrocketed to $2.74 before drifting back into the mid-$2.40s for the past few days (See graph below). Is this price a signal that we’ve dodged the bullet one more year? That the odds of natural gas storage inventories hitting maximum capacity levels are increasingly unlikely? Clearly we need to look at the Bentek supply/demand numbers once more to get a better understanding of what is going on.

Over the past month since the NYMEX natural gas contract hit the low of $1.91/MMbtu, the price has screamed upward by $.83/MMbtu, or 44% to $2.737/MMbtu yesterday, up 3 cnts. That’s a pretty good run. Do the fundamentals really support that price level? What has changed in the supply/demand balance to warrant such a turnaround? Is this price run a head fake? We’ll explore these issues today.

Yesterday was Day#1 of the annual Bentek energy analytics conference called Benposium, being held at the Houstonian hotel in Houston. I’m not speaking until Thursday so today was an opportunity to hang out and listen to some of the other presenters. The first two speakers focused on one of the most important issues being addressed at the conference – natural gas demand. Audrea Hill, Senior Director Hedging, PCS Nitrogen (unit of Potash Corporation) talked about the ammonia market, while Jim Jordan, President, Jordan and Associates (and RBN Energy contributor) examined the markets for Methanol. Both of these industrial segments are experiencing a rebirth of domestic demand for natural gas as a feedstock.

For the past two days we’ve slogged through the math of converting natural gas pipelines to crude oil service. Whether or not you spent the time to follow the details, you might have wondered – What’s the point? Some pipelines are candidates for conversion, some are not – right? It just depends on the classic real estate rule --- location-location-location. Well there may be more to it than that. A lot more. What if I told you that a typical liquids pipeline can generate four times the revenue of a gas pipeline of equivalent diameter and length. The crude pipe can move four times the energy. And clearly, four times the energy and four times the revenue leads to four times the fun of running and operating a pipeline. Right now a lot of gas pipelines are not having much fun. On the other hand, it is party time at most crude oil pipelines. Bust out the red solo cups. Let’s figure out just how much fun they are having.

Yesterday in Part 1 of this blog series on pipeline conversions we talked about Energy Transfer’s interest in switching Texoma and other pipelines from gas to crude service. That development and the proposed conversion of Kinder Morgan Interstate Gas Pipeline system into the Pony Express Crude oil pipeline got us to thinking about the economics of these conversions and the magnitude of opportunities to do more of them.

On Monday, Energy Transfer kept the deals coming with the $5.3 billion acquisition of Sunoco. This deal certainly launches ETP into the really big leagues, and makes it one of the most diversified players around. And if you read the fine print, they plan to get more diversified by converting gas lines into crude oil lines. The poster child is good ole Texoma pipeline, which was a crude pipe for years before it was converted sometime in the 80s to move natural gas. ETP CEO Kelcy Warren says he has his eye on a few other gas pipeline candidates for conversion. And don’t forget. Up in the Guernsey, WY area Kinder Morgan is converting 500 miles of the Kinder Morgan Interstate Gas Pipeline system into the Pony Express Crude oil pipeline. Hmm. Gas production is going strong in wet gas plays like western edge Marcellus and Eagle Ford, while at the same time production is declining in the dry gas plays like Haynesville. It seems like the big crude oil plays like Bakken, Permian, Eagle Ford, etc. all need more pipelines. Given the dislocation in gas production growth and the opportunities in crude markets, it certainly makes sense that conversion of pipelines should be high on the priority list for any self-respecting pipeliner.

Contributor Kyle Cooper breaks down the most significant developments in last week’s natural gas market.

It’s been a couple of weeks since we’ve looked at natural gas balances. Since today is EIA Natgas Storage day it seems appropriate to check in on the progress natural gas producers are making to cut back supplies. For readers not familiar with the quirks and foibles of the natural gas market, Thursdays are big days for gas traders. On Thursday mornings at exactly 10:30AM central time the EIA posts weekly natural gas storage inventories. Like other petroleum inventory numbers, these are not forecasts. They are EIA’s best guess at inventories at the end of last week. If you are interested, here’s the URL: http://ir.eia.gov/ngs/ngs.html.

Last week I attended the LDC Gas Forum Southeast in Atlanta. One of the folks I met at the conference was a manager of fuels risk management for a Kentucky utility. To protect the innocent, we’ll call him Joe Friday.

Yesterday was a swingin, Up-N-Down day for natural gas. See the Updata ‘Candlestick-Volume’ chart for the CME/NYMEX May contract below, that shows upticks in gray, downticks in red, with the width of the bar proportional to the volume during that trading period. So there was a big move up on the open, it was pounded down during the morning session on relatively consistent volume, then drifted back up before closing above the two dollar mark at $2.016, up 3.5 cnts. The futures market spent 3 days below $2.00 this time around. Yes, I’m suggesting that we have not seen the last of one-handle prices. For reference, cash markets didn’t seem so enthusiastic with the ICE prompt cash Henry Hub index languishing back at $1.88/MMbtu, up a penny.

Finally. The wait is over. The May CME/NYMEX natural gas contract dropped 4.7 cnts to close at $1.984/MMbtu. June was lower by the same amount, closing at $2.105. It is still another 10 year low and another milestone in the onslaught of shale production in the year-of-no-winter. The last time we saw a Natgas futures contract close at this level was Jan 28, 2002. For reference, that was one day before President Bush’s ‘Axis of Evil’ State of the Union speech. Seems like a long time ago.
