Two weeks ago we posted part 1 of a series looking to answer the question – ‘Are we likely to run into storage issues with NGLs in PADD 1 while we are waiting for infrastructure and demand side projects such as export terminals and petrochemical facilities to be built out?’ We assessed growing supply and demand mismatches, how production will move between regions, and set the stage for today’s blog where we will examine the need for and availability of NGL storage capacity in PADD 1. In today’s blog, we will finish painting the PADD 1 NGL storage picture.
|
Check out Kyle Cooper’s weekly view of natural gas markets at |
First here is a brief recap regarding NGL production growth expected in PADD 1 over the coming years from part 1 of this series, Breakin' It Up & Breakin' It Down – PADD 1 NGLs Storage Capacity: Supply and Demand. A full read of part 1 will likely be very helpful in providing context and information on infrastructure we will be referring to in today’s blog. Historically, NGL production from PADD 1 has been very low, and the need for storage has also been relatively low to keep the market balanced, but as we previously discussed in depth in the Big Surge Comes to Whoville – Northeast NGLs to Increase Six Fold between now and 2015 nearly 4.7 Bcf/d of additional cryogenic natural gas processing capacity, along with 500 Mb/d of fractionation capacity and 500 Mb/d of NGL pipeline takeaway capacity are due to come online in the Northeast to support growing Utica and wet Marcellus production. Once the above mentioned infrastructure comes online, by 2015 NGL production from the Appalachian Basin could exceed of 400 Mb/d. One way or another all of this production is going to have to find a home. Some of it will find a home locally, some will find a home in Canada, some will find a home on the Gulf Coast and some will get exported via the Marcus Hook terminal on the Delaware River.
Before we start breakin’ it down and assessing storage requirements going forward for each individual purity product we are going to take a walk back in time and look at historical PADD 1 NGL stock levels over the past 10 years.

Figure #1, Source: EIA (click to enlarge)
A lot can be gained from looking at Figure #1 above. The graph on the left shows ending stocks for propane and normal butane, with propane swinging from 1 MMbbls to 6.5 MMbbls and normal butane swinging from 0.5 MMbbls to 3.5 MMbbls. On the other hand, as shown on the graph to the right, storage requirements for isobutane swing less than 200 MBbls and storage for pentanes plus (natural gasoline) is less than 50 Mbbls. There is no ethane storage since there is little or no ethane currently produced in the PADD 1 market.
Getting back to propane and butane, note the degree of seasonality in the storage requirements of the two products. As discussed in part 1 of this series, demand for propane is highly seasonal given the primary demand source is for heating during the colder winter months. The demand for normal butane is equally as seasonal, although the overall quantity demanded is significantly smaller. For normal butane the seasonality of demand is driven by the motor gasoline blending season, also discussed in part 1 of this series. These seasonal demand cycles for propane and butane are unlikely to change any time soon. Also evident in the left chart above is the declining demand, and storage needs for normal butane and the impact of changing weather conditions on propane demand and stocks. As a result of mild weather in 2011 and 2012, propane stocks hit their historical maximum at 6.5 million barrels in Sept 2012. Thanks to some very cold weather moving in over this past winter, propane stocks in PADD 1 had fallen back down to 1.3 million barrels as of the EIA’s March 2013 data release.
Normal Butane
Normal butane stocks in PADD 1 have fallen in recent years due to refinery closures and refinery production decreases in the region. Less normal butane is being produced at refineries, and less is needed from gas plants for blendstock, see Figure #2 below for net refinery and blender inputs of normal butane since the beginning of 2009.
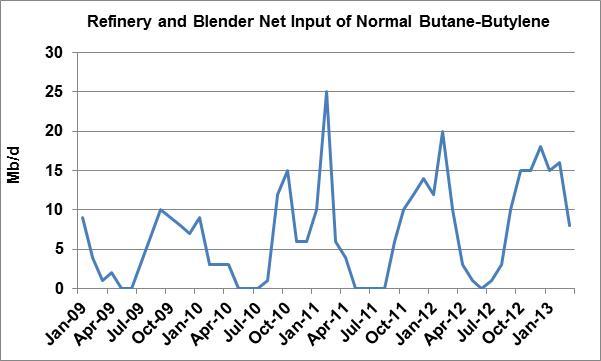
Figure #2 Source: EIA (Click to Enlarge)
While demand for normal butane in PADD 1 has been on the decline in recent years, this doesn’t preclude the need for additional normal butane storage in the coming years as gas plant supply increases. Normal butane as a percentage of the barrel is far less than either ethane or propane in PADD 1 and as a result the gas plant production increase of normal butane between 2012, 6 Mb/d, and 2015 is only 20 Mb/d. This amount should be manageable via existing storage, rail, proposed pipeline projects, and exports. During 2012, an average of 4 Mb/d of normal butane was exported from PADD 1 to Canada.
Propane
The picture gets more complex when evaluating the need for additional propane storage in the region. Recapping from part 1, historically propane demand in PADD 1 far exceeded historical gas plant and refinery supply of propane from the PADD which as of March 2013 were 38 Mb/d, and 36 Mb/d respectively. Thus, propane has historically, and continues to flow into PADD 1 via pipeline and rail. Flows into the PADD increase during the colder winter months when propane demand is higher and fall off during the spring and summer as warmer temperatures return, see chart below. Most propane moving from PADD 3 to PADD 1 is transported on Enterprise’s Dixie Pipeline to meet propane demand in the Southeast while most propane moving from PADD 2 to PADD 1 travels on Enterprise’s TE Products line which runs from PADD 3 through PADD 2 and into PADD 1 to meet Northeast propane demand. Propane has also historically been imported from Canada and via ship into PADD 1.
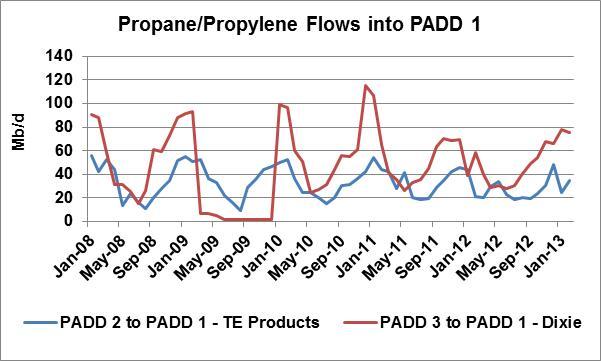
Figure #3 Source: EIA (Click to Enlarge)
As can be seen in Figure #3 above, flows from other PADDs swing significantly from summer to winter and also relative to the severity of the winter. During the mild winter in 2011/2012 less propane needed to move into the region to meet demand. In early 2013 the impact of growing gas plant supply of propane can also be seen in the chart. Gas plant production of propane has grown from 16 Mb/d in January 2011 to 38 Mb/d as of March 2013.
Join Backstage Pass to Read Full Article


