We’ve done several blogs over the past months about the impact of the back-to-back crop drying and Polar Vortex anomalies on natural gas liquids (NGL) prices in general and propane prices in particular. Today we are going to take a walk further downstream and look at how increasing propane exports, the weather related anomalies and subsequent price spikes shifted the petrochemical feedstock slate. From mid-year 2013 to early 2014, huge volumes of propane were backed out of the petrochemical sector, replaced for the most part by ethane. These swings have important implications for the future consumption of NGL feedstocks by petchems. In today’s blog, we assess petrochemical feedstock switching in the 2013-14 timeframe, and beyond.
In the U.S. there are 37 steam crackers (a.k.a. olefin units or ethylene units) owned by 15 companies which soak up the majority of the NGLs consumed in the petrochemical sector. In aggregate, these units consume over 1.6 MMb/d of NGLs as feedstock, which is just over half of all U.S. NGL consumption. Most of these units are on the Gulf Coast. Ethane holds the largest share of the feedstock market with propane, naphtha (natural gasoline) and normal butane holding the second, third and fourth positions, respectively. Steam crackers also use a small volume of gas oil (distillate range material) as a feedstock.
Before we jump further into the volume analysis, the mechanics of feedstock switching, and why 180 Mb/d of propane left the steam cracker market over the past 7 months, let’s first do a quick review of what drives ethylene production economics. Not only does the industry have the ability to produce ethylene from the various feedstocks described above, but many individual units are designed to operate on the optimal range of feedstocks that produce the highest level of profitability at a point in time. In other words, the plants can swing from one feedstock slate to another. Not all units are so fortunate. Some are limited to only a single feedstock. But for our purposes in this blog we will focus on the behavior of those flexible cracker units.
One of the challenges for the feedstock buyers for these units is that each feedstock has a different product yield. The primary product being produced is ethylene (hence the moniker ‘ethylene unit’). But they also produce significant quantities of byproducts, including propylene, butadiene, benzene, toluene, xylene, etc. The catch is that each feedstock has a different yield of ethylene and each of the byproducts. For example, ethane produces a lot of ethylene and not much in the way of byproducts, while natural gasoline (naphtha) produces more byproducts than ethylene. To put all these feedstocks on an apples-to-apples basis, most olefin unit feedstock purchasing decisions look at profitability from the perspective of ethylene margin. In other words, buyers for olefin units purchase the slate of feedstocks that will produce the highest margin ethylene possible, after factoring in byproduct “credits” and considering the operating constraints of their facility. A byproduct credit simply takes the value of the byproducts sold per pound of ethylene produced, and adds that to the ethylene margin.
The simplistic version of this ethylene margin equation is below:
For a more in-depth discussion on calculating margins for producing ethylene please see Let’s Get Cracking - How Petrochemicals set NGL Prices. Also, we calculate these margins each day for a representative Gulf Coast flexible cracker and display the graphic results in Spotcheck, a service provided in RBN’s Backstage Pass premium service. For more information on Spotcheck, click here or scroll to the bottom of the RBN Energy home page.
Looking back in not too distant history, the margins for producing ethylene from all feedstocks were relatively low. Figure #1 below shows the margins for producing ethylene from ethane, propane and natural gasoline. From 2005 to 2008, the margins were15 c/lb or under. It was much worse in 2009 as the petchem industry dealt with the great recession. But once we entered the shale gas revolution and oversupply in ethane and propane markets pushed the prices for those products down, the story changed rapidly with significant margin growth occurring for the lighter feedstocks (ethane and propane) from 2010 to 2013. Margins for producing ethylene from ethane averaged nearly 50 c/lb during 2013, almost five times the level seen during the mid-2000s.
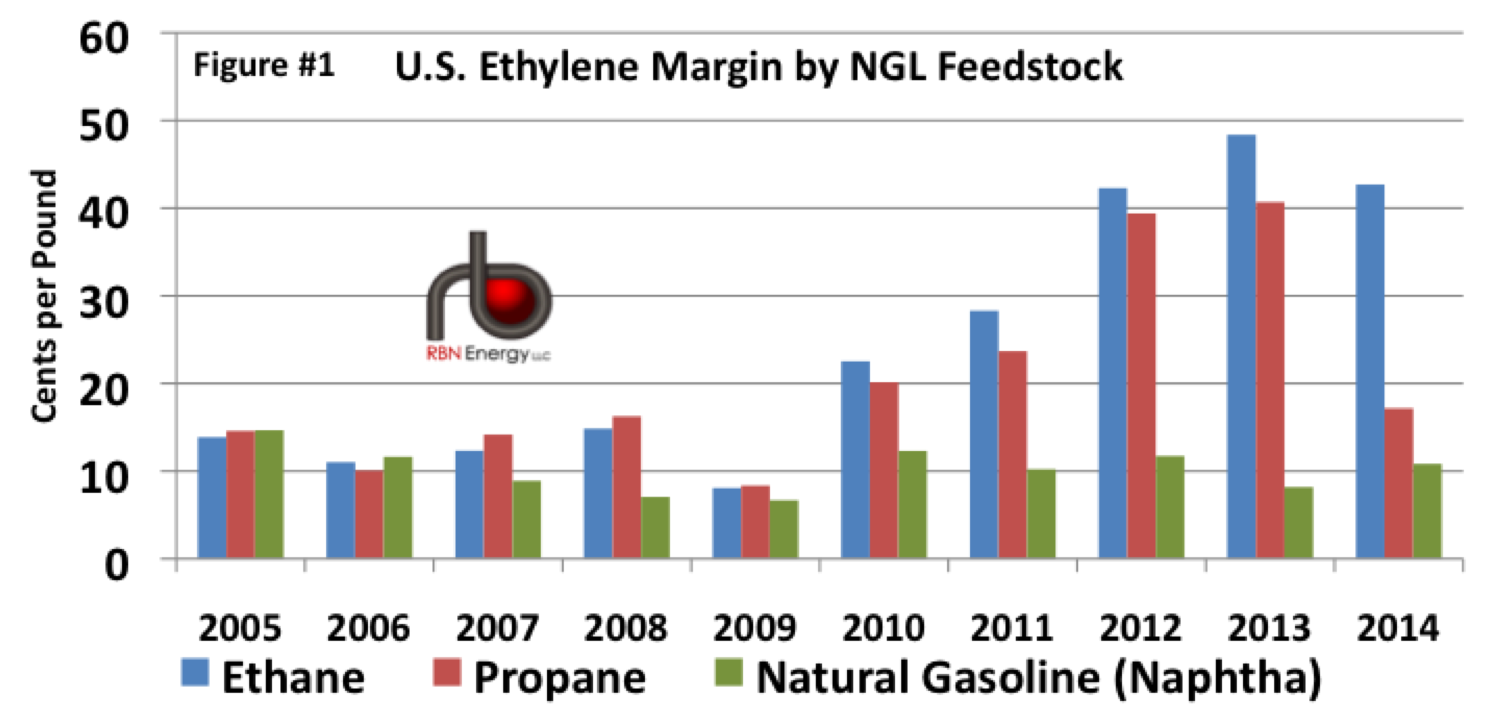
Source: RBN; NGL prices from OPIS
Narrowing in on more recent history 2012- 1Q 2014 and now looking at daily data (Figure #2 below) we can see that the feedstock margin relationships have changed over the past 9 months. During 2012 and the first half of 2013, the margins for producing ethylene from ethane and propane were running very close together (blue dashed oval). Then increased propane exports kicked in. As we described in Sail Away – Propane Exports Exceed 400 Mb/d for the First Time, new Gulf Coast export capacity came online with Enterprise’s export terminal expansion and Targa’s expansion both fully operational by fall. Propane export capacity was available, international prices encouraged exports, export volumes started to increase and inventories started to decline. The unsurprising result was rising prices throughout the fall. Then as seasonal heating demand ramped up, prices followed suit and propane became less and less competitive in the petrochemical sector (see lines inside orange circle). Then the propane market in the midcontinent was hit by back-to-back record corn drying demand and more record demand from the polar vortex weather patterns. (See Farmer Dries Corn and I Do Care) As the market moved barrels into the midcontinent to meet the spectacular surge in demand, the call on Mont Belvieu barrels or volumes that would have been destined for Mont Belvieu, resulted in a run-up in Mont Belvieu propane to $1.70/gal in late January/early February 2014. At that price, the margin for producing ethylene from propane fell to zero, dropping below the margin for producing ethylene from natural gasoline (purple arrow).


Comments
Kelly,
Excellent, well written article.