The upcoming presidential election has filled the airways with discussions around crucial issues, some with dramatic short-term (yet highly variable) impacts and others that will play out over several years. The impact of the critical short-term issue facing oil and gas producers today — historically low natural gas prices — varies depending on the structure of individual company portfolios. In today’s RBN blog, the last of our four-part series, we analyze the effect of lower gas prices on the revenues, cash flows, investment, leverage and cash allocation of Oil-Weighted E&Ps and discuss how they are adapting.
In Part 1 of this series on recent financial results from the 40 large U.S. E&Ps we monitor, we said their pre-tax operating profits rebounded slightly in Q2 2024 to $12.25/boe ($16.6 billion), up 1.8% from the $12.04/boe they reported in Q1 2024. The group as a whole outperformed during the turbulent half-decade from 2015-19 but has generally fallen short of results in the post-COVID years. The primary reason was that low natural gas realizations nearly offset the impact of higher liquids realizations for the entire group.

Join us at our historic 20th School of Energy!
School of Energy: Foundations is a two day, in person conference designed to help energy professionals better understand the forces shaping crude oil, natural gas, NGLs, refined products, and petrochemicals.
Attendees will learn from RBN experts, work with Excel based analytical models, participate in Q&As, and network with industry peers.
Build the foundation to better navigate volatile energy markets.
As we reviewed in Part 2, the Gas-Weighted producers we track, with a portfolio weighting of just 16% liquids, reported an aggregate $850 million in losses in Q2 2024. And as we said in Part 3, the 13 Diversified E&P companies we follow — which produced 50% oil, 35% natural gas and 15% NGLs, on average — saw their total revenue from natural gas fall by 37%, or more than $1 billion, to just $1.8 billion. That nearly offset a $1.3 billion increase in oil revenue to $19.5 billion. Particularly hard hit were the producers with Permian assets, many of which have been hurt by often-negative gas prices at the Waha Hub in West Texas (see Don’t Blame Me).
The 15 Oil-Weighted E&Ps we cover — which produced 53% oil, 22% liquids and 25% natural gas — posted the most solid historical results in Q2 2024 as realized prices increased 1.1% to $48.82/boe, despite the historically low gas prices. The major reason is that natural gas sales make up a negligible part of the group’s total revenue. The oil producers generated just 4%, or $959 million, from gas sales during the quarter. Excluding the $406 million in international gas sales by Hess, Marathon Oil and Occidental Petroleum (Oxy), that share drops to just 2%. It’s no surprise that with Permian gas prices at the Waha Hub that averaged minus $0.47/MMbtu during the quarter, Ring Energy, Riley Permian and Vital Energy reported negative Q2 2024 gas revenues. (Waha prices slumped to minus $0.76/MMBtu during Q3.) Diamondback Energy, which reported $2 billion in oil sales, had gas revenue of just $5 million while fellow pure Permian producer HighPeak Energy garnered only $700,000 of its $276 million in revenue from natural gas. Oil prices and production are the drivers of capital allocation, profitability and shareholder returns for the group.
Capital & M&A Spending
Organic capital spending reached nearly $50 billion in 2014 as oil prices soared above $100/bbl but the late 2014-15 collapse in oil and gas prices drove capex down by nearly three-quarters by 2016 to $14 billion (blue bar and left axis in Figure 1 below). Capex started to recover in 2017, reaching $23 billion and then nearly $30 billion in 2018-19. In early 2020, the COVID epidemic gripped the global economy, sending oil and gas prices reeling once again. Finding-and-development (F&D) spending was cut in half to $12.6 billion and sustained at nearly that level in 2021 as companies focused on strengthening their balance sheets. However, rising oilfield-services inflation and the necessity of resuming development to sustain crude oil output over the long run led to a 47% increase to $20 billion in 2022 and a 33% rise to $26.5 billion in 2023. In response, organic capex budgets for the group have dipped 9% in 2024.
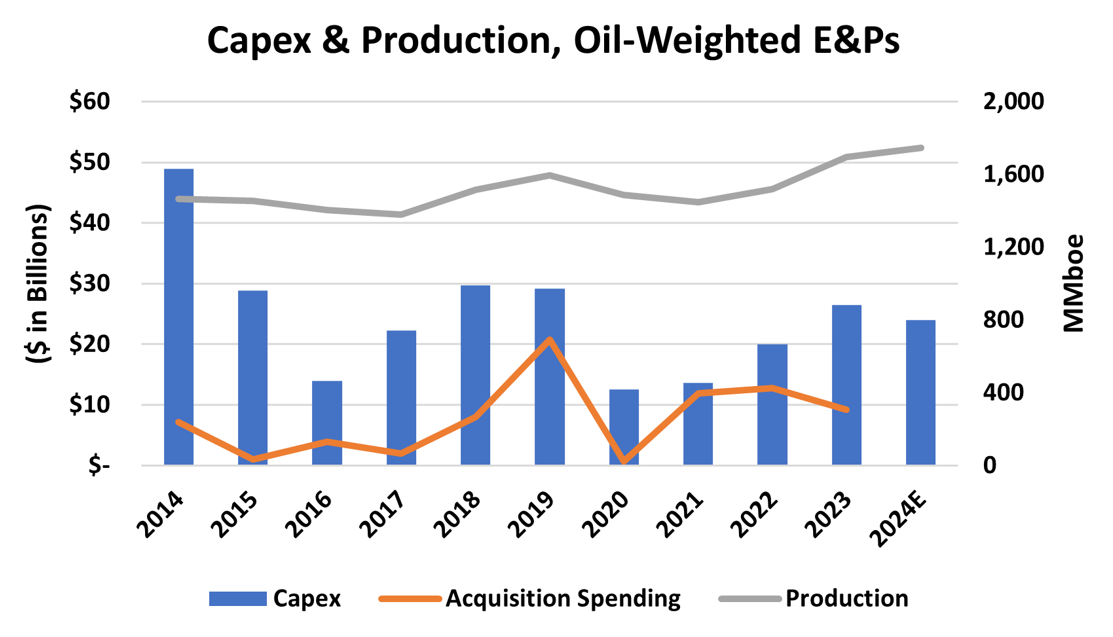
Figure 1. Capex and Production, Oil-Weighted E&Ps, 2014-Q2 2024. Source: Oil & Gas Financial Analytics, LLC
About the song
“Bad Moon Rising” was the lead single from Creedence Clearwater Revival’s third album, Green River. Written and produced by John Fogerty, the song was recorded at Wally Heider’s Studio in San Francisco in March 1969. The single reached #2 on the Billboard Hot 100 singles; the Green River LP went to #1 on the Billboard 200 album chart.
John Fogerty has said he wrote “Bad Moon Rising” after watching “The Devil and Daniel Webster,” and was inspired by a scene in the movie involving a hurricane. The last line of the chorus — “There’s a bad moon on the rise” — has often been misheard as "There’s a bathroom on the right," and Fogerty has been known to sing that line sometimes in concert. The song has been used in numerous films and television shows.
Creedence Clearwater Revival, also referred to as CCR, included John Fogerty (lead and backing vocals, lead guitar and piano), Tom Fogerty (rhythm guitar), Stu Cook (bass) and Doug Clifford (drums). The band was formed in the San Francisco Bay area in 1967 and released seven studio albums from 1968 to 1972 — they disbanded in October of that year. John Fogerty went on to have a successful solo career and still tours today. Tom Fogerty (John’s older brother) released several solo albums before passing away in 1990. Stu Cook and Doug Clifford still tour today as Creedence Clearwater Revisited, playing a repertoire of CCR songs. Creedence Clearwater Revival was inducted into the Rock and Roll Hall of Fame in 1993.