Increased refined product exports from US Gulf refineries are being driven by diesel refining margins but a lot of by-product gasoline is being produced as a result. Domestic demand for diesel and gasoline has declined over the past 5 years. Fortunately for refiners there is strong demand for diesel and gasoline in Latin America as well as for diesel in Europe. Important cost advantages stemming from the shale revolution are helping Gulf Coast refiners secure these markets against international competitors. Today we conclude our analysis of booming Gulf Coast exports.
Recap
This blog is the second in a two part series looking at the drivers behind increased US exports of refined products from the Gulf Coast region. In Part 1 our analysis showed that the volume of Gulf Coast diesel exports is generally correlated with refinery operations. That means that the more crude Gulf Coast refiners process the more diesel exports increase. And because refineries typically produce more gasoline than diesel then ramping up diesel supplies brings with it an increase in by-product gasoline supplies. But diesel is the primary driver because diesel margins at the Gulf Coast have remained consistently robust even when gasoline margins turned negative. This time we look at the impact of domestic demand for diesel and gasoline on exports, where US exports are headed and how US refineries are competing to win export market share.
Domestic Demand
We start with domestic demand for diesel and gasoline. Figure 1 shows the results of analysis of Energy Information Administration (EIA) data to determine the “apparent demand” for gasoline (red line) and distillates (blue line – mostly diesel) in the US. We explained how apparent demand is calculated back in June 2012 (see No Apparent Demand) but provide a quick recap here. The first thing to note is that the calculation is really only meaningful for the US as a whole because although the EIA data is also broken out by region those regional numbers do not capture all the movements between regions accurately. So we are looking at total US numbers. The calculation starts with daily refinery production of (in our case) gasoline or diesel. To this we add net daily imports, which means the volume of imports minus exports. [Nowadays for both diesel and gasoline that net import number is generally a negative meaning that the US is a net exporter.] Production plus net imports gives us the daily volume of new product available to the domestic market except for changes in inventory. So the final part of the apparent demand calculation estimates the daily amount of product added to or withdrawn from inventory. The weekly change in stocks divided by seven gives us that daily inventory change value. In the case of distillates the apparent demand calculation looks like this:
Apparent Demand = Total Refinery Distillate Production + Total Distillate Imports – Total Distillate Exports + (Distillate Stocks Last Week – Distillate Stocks This Week) / 7
The gasoline calculation uses the same method but is more complex because we have to include both finished motor gasoline and gasoline blending components. The gasoline methodology is explained in detail in No Apparent Demand.
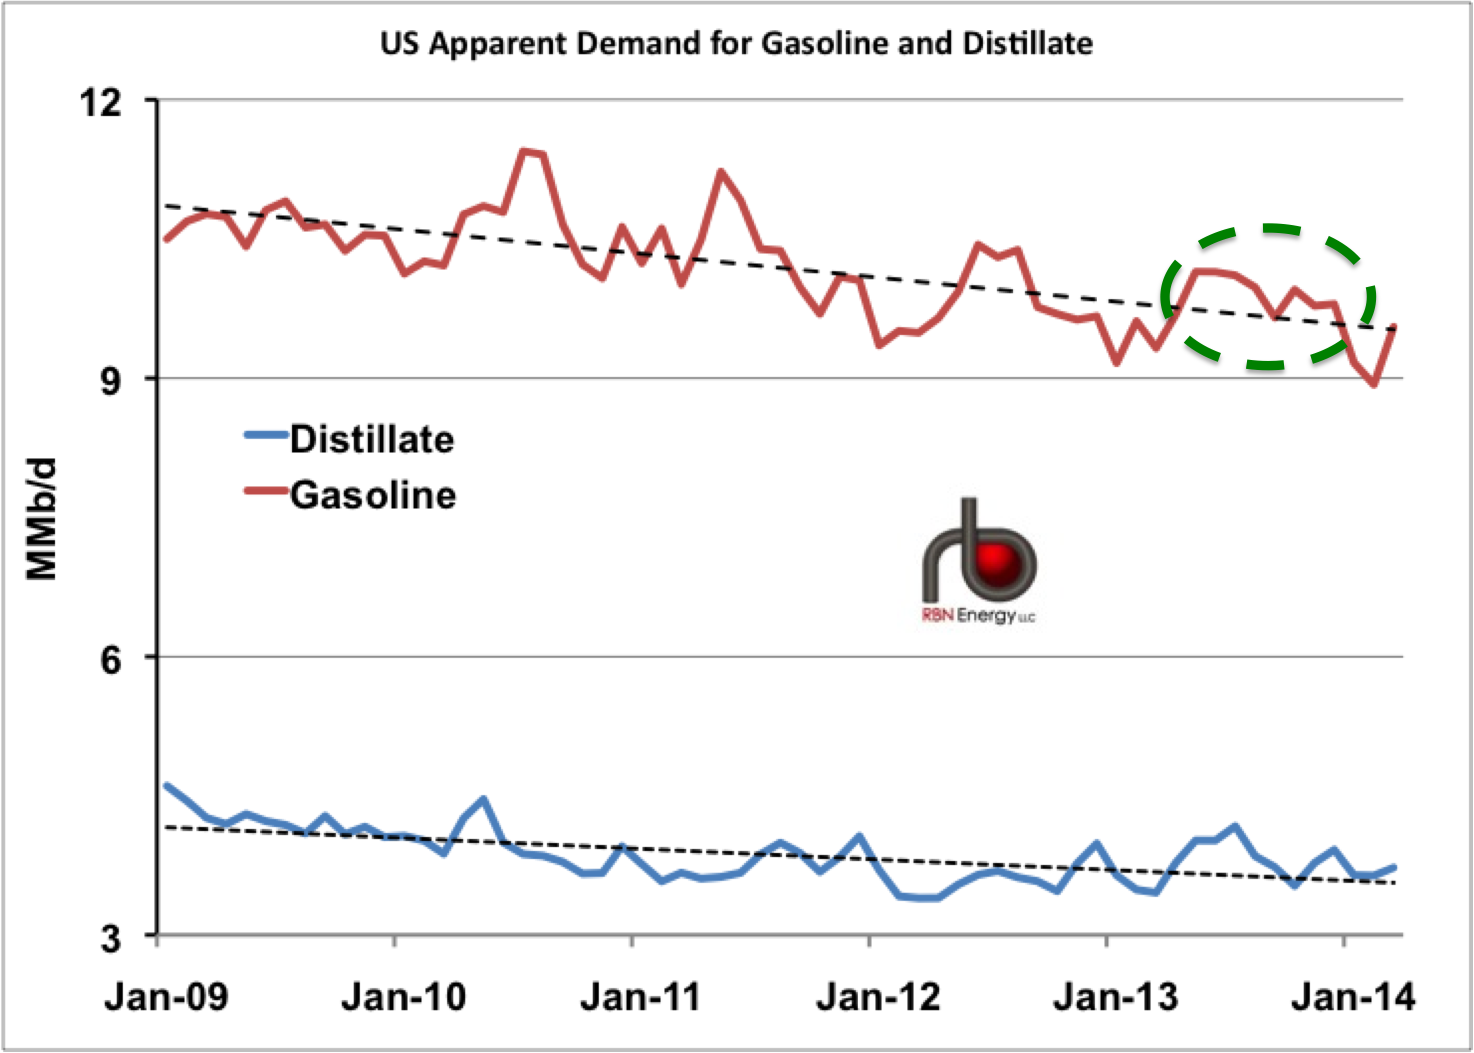
Figure 1
Source: RBN Energy using EIA data from Morningstar (Click to Enlarge)
Back to the apparent demand results shown in Figure 1. We smoothed out the data using a monthly average and the date range is five years. The black dashed trend lines on the chart show that apparent demand for both gasoline and diesel in the US has declined over that five-year period and that the decline in gasoline has been steeper than for diesel. Also note that demand for diesel in the US is less than half the demand for gasoline because most US transportation uses gasoline. There are two big drivers behind declining demand for gasoline - namely the mandated increase in the use of renewable ethanol to replace gasoline in motor fuel and increased auto fuel efficiency standards that reduce consumption.
Comments
Sandy,
Excellent post as always.
What will the new EPA mandates requiring California standards for all US gasoline mean for the Gulf Coast? It seems like the robust and growing abilities of the Gulf Coast refining industry might create a case for building a refined products pipeline to California, serving a role similar to that of the Colonial Pipeline to the East Coast.
Kinder Morgan had previously hoped to build the Freedom pipeline to export crude to California, but evidently California refineries found that the economic value of railing crude made more sense. Given the declining refined products market on the West Coast, the increased regulatory expense affecting railing crude, the new EPA mandate and the Gulf Coast cost advantage, a business case for building a refined products priceline to the West Coast might make sense.
In addition the pipeline could be used to export refined product from the Gulf Coast to Asia. While the delayed Panama Canal expansion would also increase those exports, a pipeline could prove even more cost effective.
Thank you, Tom Morgan, Drillingfino, Austin, Texas