U.S. crude oil exports averaged 4.6 MMb/d last week, rocketing up by 1.8 MMb/d from the prior week to the highest weekly rate since mid-November. The four-week moving average is now 3.8 MMb/d, up about 90 Mb/d from the previous week.
Analyst Insights
Analyst Insights are unique perspectives provided by RBN analysts about energy markets developments. The Insights may cover a wide range of information, such as industry trends, fundamentals, competitive landscape, or other market rumblings. These Insights are designed to be bite-size but punchy analysis so that readers can stay abreast of the most important market changes.


By Martin King - Tuesday, 1/21/2025 (11:00 am)
Combined natural gas production of the equity partners in LNG Canada reached a record 2.26 Bcf/d in November 2024 (combined height of the rightmost colored bars in chart below), a slight gain of 0.01 Bcf/d versus October and 0.4 Bcf/d higher than one year ago.
By Lisa Shidler - Tuesday, 1/21/2025 (10:45 am)
Report Highlight: LNG Voyager
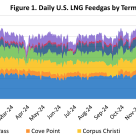
Total U.S. LNG feedgas demand averaged 14.76 Bcf/d last week, up 32 MMcf/d from the week prior, with a big jump up in intake at the new Plaquemines LNG offsetting lower inflows at Freeport.
By RBN Team - Tuesday, 1/21/2025 (9:30 am)
Report Highlight: U.S. Propane Billboard
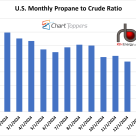
With colder weather, the price of propane is up slightly to about 47% the price of NYMEX crude. The ratio averaged less than 40% in December. This is the highest the ratio has been since September 2024 when it averaged about 50%.

By Martin King - Monday, 1/20/2025 (5:15 pm)
In recent weeks, the price spread in the Gulf Coast region for Western Canadian Select (WCS) and Access Western Blend (AWB), two grades of Canadian heavy crude oil that are actively traded for physical delivery to refiners and exporters in the Gulf Coast region, have been hovering at their narrow

By Martin King - Monday, 1/20/2025 (4:15 pm)
Gas intake developments at LNG Canada remain uncertain. The latest community update released by LNG Canada on January 18 indicated that it would be undertaking increased flaring on January 20 and which will occur intermittently in the follow-on four week period.

By RBN Team - Monday, 1/20/2025 (2:15 pm)
Report Highlight: NGL Voyager
Commodity trader Trafigura and CF Industries, the world’s largest ammonia producer, have successfully completed the first shipment of ammonia with LPG on the same vessel, demonstrating the ability to transport low-carbon ammonia to ports with less demand for full ammonia shipments.

By John Abeln - Monday, 1/20/2025 (11:15 am)
Report Highlight: NATGAS Permian
Natural gas production in the Permian Basin was relatively strong between 20.28 to 20.48 Bcf/d last week but then dropped by nearly 0.5 Bcf/d on Sunday as temperatures in the basin plummeted. Production levels dropped to 19.65 Bcf/d on Monday.

By Jeremy Meier - Friday, 1/17/2025 (2:45 pm)
US oil and gas rig count declined for the second consecutive week, falling to 580 for the week ending January 17 - a decline of four vs. a week ago according to Baker Hughes.

By John Abeln - Friday, 1/17/2025 (1:00 pm)
Report Highlight: NATGAS Billboard
The Energy Information Administration reported Thursday that 258 Bcf was withdrawn from storage during the week ended January 10, decreasing the U.S. working gas inventory to 3,115 Bcf. This is nearly identical to the 257-Bcf average of the 10 estimates submitted to the Bloomberg survey.
By Martin King - Friday, 1/17/2025 (12:45 pm)
Report Highlight: Canadian Natgas Billboard
For the week ending January 17, Baker Hughes reported that the Western Canadian gas-directed rig count rose one to 73 (blue line and text in left hand chart below), ten less than one year ago and its highest level since the final week of March 2024.

By Jason Lindquist - Friday, 1/17/2025 (10:15 am)
Report Highlight: Hydrogen Billboard
The first map showing the prospective locations of naturally occurring geologic hydrogen resources in the contiguous U.S. was published Friday by the U.S. Geological Survey (USGS). The map is derived from an analysis of geologic conditions favorable for hydrogen.
By Taylor Noland - Friday, 1/17/2025 (9:30 am)
Report Highlight: Crude Oil Permian
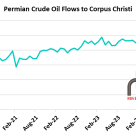
Crude oil flows from the Permian Basin to Corpus Christi returned to record highs in August 2024, climbing 73 Mb/d from July to reach 2.43 MMb/d (see blue line in the graph below), a level previously reached in March 2023, according to the latest monthly data from the Texas Railroad Commission.

By Martin King - Thursday, 1/16/2025 (1:15 pm)
The cash price of Western Canada’s natural gas price marker of AECO continues to struggle at levels well below C$2/GJ ($1.46/MMBtu), despite what has been winter’s icy cold grip descending upon most of North America in the past 10 days.

By John Abeln - Thursday, 1/16/2025 (9:45 am)
Report Highlight: NATGAS Appalachia
Northeast weather shifted toward the cold side last week, with temperatures far below the average for this time of year. Weather was particularly cold on Wednesday and Thursday of last week, but things also got chilly this Monday and Tuesday. Overall, Northeast demand averaged 33.4 Bcf/d.
By RBN Team - Wednesday, 1/15/2025 (3:45 pm)
Report Highlight: U.S. Propane Billboard
It’s propane weather in the Midwest, with cold fronts moving through the Ohio Valley and on into the MidAtlantic region. And no surprise, propane prices at the regional Conway, KS hub are doing exactly what they are supposed to do in such weather conditions – moving higher.
By TJ Braziel - Wednesday, 1/15/2025 (3:00 pm)
Report Highlight: Crude Oil Billboard
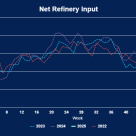
Net refinery input decreased by 250 Mb/d to 16.65 MMb/d, and gross input declined by 275 Mb/d to 18.35 MMb/d last week (see chart below).

By RBN Team - Wednesday, 1/15/2025 (1:45 pm)
Report Highlight: U.S. Propane Billboard
The EIA reported total U.S. propane/propylene inventories fell by 4.7 MMbbl (red bar in top chart) for the week ended January 10, which was above industry expectations for a decrease of 3.2 MMbbl and above the average draw for the week of 3.5 MMbbl (green bar).

By Taylor Noland - Wednesday, 1/15/2025 (12:15 pm)
Report Highlight: Crude Oil Permian
Atlas Energy’s first commercial delivery via the Dune Express, a project we detailed in Enter Sandman, marks a major milestone in proppant logistics within the prolific Pe

By Paige Hambric - Wednesday, 1/15/2025 (11:45 am)
Report Highlight: U.S. Propane Billboard
Snow, ice, and transport limitations are putting pressure on propane logistics. Transportation waivers in 22 states provide temporary relief, but will supply keep up with demand as conditions worsen?
