The rapid growth in U.S. natural gas production and LNG exports over the past 10 years was just the beginning. Between now and 2035, gas production in the Permian, Eagle Ford, Haynesville and other plays will continue rising, the Gulf Coast’s LNG export capacity will double and many new pipelines will be built. New gas-fired power plants will be added, too. The shifts in gas flows as new production and infrastructure come online will be frequent and often sudden, as will the changes in basis at gas hubs throughout Texas and Louisiana. Is there any way to make sense of it all? There sure is. In today’s RBN blog, we continue to explore how our Arrow Model helps guide the way.

Few, if any, would argue with the view that the world is changing at a breakneck pace and that there are many “unknowable unknowns” out there. But this much seems clear: (1) the more than 8 billion people on this planet will need more energy; (2) natural gas is among the cleanest, most abundant forms of reliable, around-the-clock energy supply; and (3) the U.S. has super-abundant gas reserves and the means to export vast amounts of LNG to Asia, Europe and other major gas-consuming regions. The question is, how will the era of U.S. gas/LNG leadership unfold, particularly in Texas and Louisiana, the two states at the center of most of the action.
In Part 1, we summarized where things stand today regarding gas production, pipeline development and LNG export capacity in the Lone Star and Bayou states. The bottom line? Gas production is rising in the Permian and to a lesser degree is poised to do the same in the Eagle Ford and the Haynesville as new takeaway pipelines — and, just as important, new LNG export terminals — start up. We also discussed RBN’s Arrow Model — now available for purchase — which carves the region into gas-flow “corridors,” with the green arrows in Figure 1 below showing groups of pipes that serve similar markets from comparable supply sources, the red arrows showing gas exports to Mexico, and the light- and dark-blue arrows showing LNG exports.
RBN’s Arrow Model for Texas/Louisiana Gas Flows
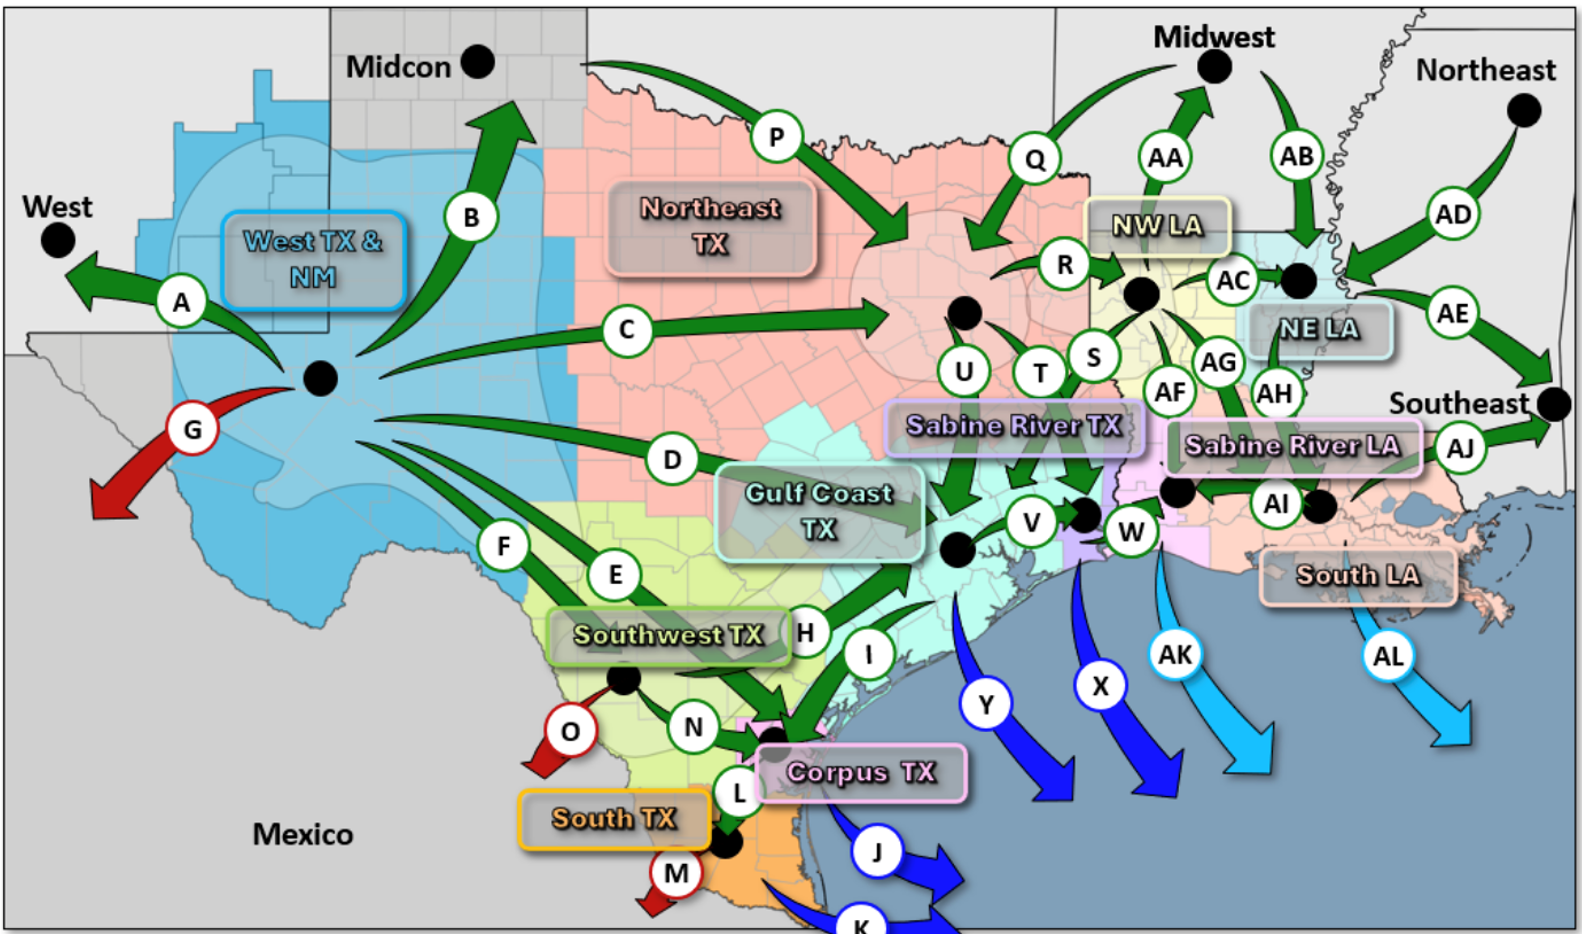
Figure 1. RBN’s Arrow Model for Texas/Louisiana Gas Flows. Source: RBN’s Arrow Model
We covered how the Arrow Model (1) aggregates gas production, demand and net outflows or inflows for each market area over time; (2) quantifies the degree to which gas is pushed/pulled between and among hubs, again over time; (3) anticipates gas flows on each corridor (and the need for incremental pipeline capacity); and (4) forecasts the basis differentials that underlie and support the aforementioned flows of gas. We also noted that the model gives you access to a host of relevant historical data and forecasts for gas production, pipeline flows, supply, storage, demand, regional balances and basis — month-by-month for the period from January 2022 through December 2026 as well as annual data and forecasts for the period from 2022 through 2035. (For more on what you can get, click here.)

About the song
“All Shook Up” was written by Otis Blackwell and was recorded by Elvis Presley at Radio Recorders in Hollywood in January 1957. Elvis Presley’s name appears as a co-writer on the song. Future Last House on the Left actor David Hess, using the name David Hill, first put out the song on Aladdin Records under the title “I'm All Shook Up.” Interestingly, only Otis Blackwell’s name appears on early releases of the single. Presley’s name appears on later copies and on his own version of the song. Presley’s version, backed with “That's When Your Heartaches Begin,” was released in March 1957. It went to #1 on the Billboard Hot 100 Singles chart and has been certified 2X Platinum by the Recording Industry Association of America. Many artists have covered the song, with a scorching version done by The Jeff Beck Group featuring Rod Stewart on vocals on their 1969 studio album, Beck-Ola. Personnel on the Elvis version were: Elvis Presley (lead vocals, percussion), Scotty Moore (lead guitar), Bill Black (bass), D.J. Fontana (drums), Gordon Stoker (harmony, backing vocals), Hoyt Hawkins (piano, backing vocals), and Neal Matthew (backing vocals).
Elvis Presley was an American singer and actor known as “The King of Rock and Roll." He is one of the most influential cultural figures of the 20th century. After driving a truck and singing with various country and western groups around Memphis, he was discovered by Marion Keisker and Sam Phillips at Sun Records in Memphis in 1954. After Presley became widely popular in the South, Tom Parker started managing him and got him a recording contract with RCA Victor. “Heartbreak Hotel” was his first release for his new label — it went to #1 on the Billboard Hot 100 Singles chart. In November 1956, Presley made his film debut, starring in the hit movie Love Me Tender. He would release 24 studio albums, nine live albums, 17 soundtrack albums, 21 compilation albums, 38 EPs and 113 singles and star in 31 motion pictures and seven documentary films. Presley won an ASCAP Award, an American Music Award and three Grammy Awards. He is a member of the Rock and Roll Hall of Fame, Country Music Hall of Fame, Gospel Music Hall of Fame, Rhythm & Blues Hall of Fame and Rockabilly Hall of Fame, and has a star on the Hollywood Walk of Fame. Presley died at his Graceland home in Memphis in August 1977 at the age of 42.