After exceptionally mild weather nearly derailed the U.S. natural gas market earlier this year, the gas supply/demand balance is set to end the 2016-17 withdrawal season relatively bullish compared to last year. Storage is finishing the season more than 400 Bcf lower than last year, albeit still 260 Bcf/d above the 5-year average. In addition, gas exports are continuing to ratchet higher. The April 2017 CME/NYMEX Henry Hub natural gas futures contract expired Wednesday (March 29) at $3.175/MMBtu, nearly $1.30 (67%) higher than the April 2016 contract settlement of $1.90/MMBtu and also about 55 cents higher than the March 2017 contract settlement. Yet, with the storage inventory still higher than the 5-year average and production growth on the horizon, the market remains susceptible to downside risk if incremental demand doesn’t show up. In today’s blog, we look at potential supply/demand scenarios for injection season.
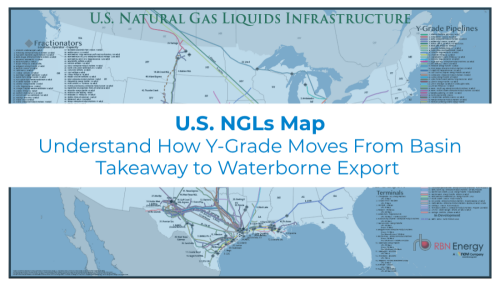
Visualize the infrastructure behind U.S. NGL movement.
The U.S. NGLs Map provides a comprehensive view of the transport, processing, and export networks moving NGLs across the U.S.
The U.S. natural gas market exited the first quarter of 2016 from one of the most bearish winters on record, with more than an 800-Bcf “surplus” in storage compared to the 5-year average, about 1,000 Bcf more than the prior year, and gas prices depressed below $3.00/MMBtu. Nevertheless, by the end of the year, the market had not only managed to wipe out the surplus versus both the prior year and the 5-year average but also ended up net short supply on average for the year and prices were approaching $4.00/MMBtu. Both the supply and demand sides of the balance equation contributed to this remarkable shift. In 2016, total supply including imports averaged 77.5 Bcf/d, down 1.3 Bcf/d from 2015. Total demand including exports averaged 78.5 Bcf/d, up 1.3 Bcf/d year on year. So the resulting net balance (supply minus demand) went from positive 1.6 Bcf/d in 2015 to negative 1.0 Bcf/d in 2016. In other words, the gas supply and demand balance ended up averaging 2.6 Bcf/d “shorter supply” in 2016 versus 2015. We walked through each component of the 2016 balance in “You Keep Me Hanging On” Part 1, but here’s a brief recap of the biggest drivers:
On the supply side, U.S. gas production in 2016 fell a whopping 1.8 Bcf/d, posting its first year-on-year decline of the decade. Lower rig counts finally caught up to producers who had until then managed to maintain or grow production by drilling better and faster with fewer rigs, while capacity constraints out of the Northeast also contributed to growth flattening out there. Tightening the balance further was the fact that demand rose about as much as production fell. While mild weather stunted residential and commercial heating demand earlier in the year, just about all other gas demand climbed—to record levels in many cases—spurred on by lower prices and export capacity additions. A stand-out was the rapid rise of new demand from LNG exports, which ramped up for the first time in February 2016 and quickly grew to more than 1.0 Bcf/d by the end of the year (see ”Feels Like the First Time Part 1” and Part 2).

About the song
"You Keep Me Hangin' On" was a #1 hit on the Billboard Hot 100 for The Supremes in 1966. Written by the trio of Lamont Dozier and brothers Brian and Eddie Holland, it was one of their songs that defined the Motown sound of the late 1960s. In 1967 a vastly different rock version of the tune was released by Vanilla Fudge; it became that band’s biggest hit. Since then, cover versions of the song have returned it to the Billboard Hot 100 several more times, making it one of only six songs to achieve that feat.