Last week, panic over gas availability and energy reliability this winter sent international natural gas and LNG prices above $30/MMBtu for the first time. Asia’s Japan Korea Marker (JKM), Europe’s Dutch Title Transfer Facility (TTF) and the UK National Balancing Point (NBP) once again had multiple days in a row of all-time high settlements, as the undersupplied market struggles to find balance. The global shortage has also impacted the gas-rich U.S. market, which is linked to it through LNG exports. The U.S. markets are tight and might also face undersupply this winter, albeit, probably not to the point of triggering reliability issues that are already emerging abroad. If it did, the U.S. exports nearly 10 Bcf/d of LNG, which could be throttled back to free up additional supplies for domestic use. Nonetheless, Henry Hub prices climbed to nearly $6/MMBtu last week and hit post-2008 record highs. This is by no means the first-time various markets have faced considerable imbalance. In fact, last year at this time we were coming out of a period of widespread oversupply and record-low gas prices. But it’s certainly foreboding that it’s not even winter yet, and prices are skyrocketing to new heights. So the big question on everyone’s mind is how bad could this get? The answer of course is complicated and heavily dependent on weather. In today’s RBN blog, “To the Moon and Back – U.S., International Gas Markets Strap in for Wild Winter Ride,” Lindsay Schneider takes a look at how we got here, how LNG has intertwined the international energy markets more than ever, and what that means for the winter ahead.
There are a host of factors, domestic and international, that drive the world’s major gas-consuming markets. What ties the various gas markets to each other is, of course, LNG. In 2020, the U.S. was the third-largest exporter of LNG, exporting nearly 2,400 Bcf for the year, behind only Australia and Qatar. And that was during a year when most U.S. terminals ran well below full utilization for a large chunk of the year as COVID caused more cargoes to be canceled than lifted over summer 2020. If normalized over the year, U.S. exports last year came to about 6.5 Bcf/d. This year to date, with terminals operating mostly at full capacity and new trains coming online, the U.S. has averaged 9.25 Bcf/d, only about 1.2 Bcf/d behind where Australian and Qatari exports each were last year. As LNG output in the U.S. has grown, so has the connection between U.S. gas prices and those of its export trading partners. LNG exports have added nearly 11 Bcf/d of feedgas demand since 2016, and that’s soon to be 12.25 Bcf/d as two new LNG projects come online early next year (see Hear My Train A Comin’). Additionally, that demand is year-round, which means the U.S. market needs to contend with feedgas demand on top of the winter peak for U.S. domestic demand. This winter, feedgas demand is likely to be about 2.6 Bcf/d above last winter’s levels based on capacity expansions and the expectation that the terminals run at full capacity all winter, though operational issues and weather can always throw a wrench into that, like we saw last February with Winter Storm Uri.
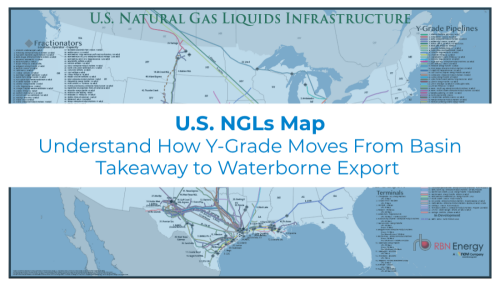
Visualize the infrastructure behind U.S. NGL movement.
The U.S. NGLs Map provides a comprehensive view of the transport, processing, and export networks moving NGLs across the U.S.
While the connection between the U.S. and its trading partners is heavily influencing the benchmark price at Henry Hub right now, the U.S. generally has enough production to support its own demand as well as exports. That surplus is a big reason why LNG exports were developed here in the first place. But the COVID recovery has been lopsided, with the rebound in demand outpacing supply gains. We are now facing a period of high demand after a year that saw capital expenditures across the energy industry slashed and relatively little investment in supplies or infrastructure (see Where Has All The Capex Gone?). That has left U.S. production levels well below what had been expected when the newest LNG projects were sanctioned, pre-COVID. Further, producers haven’t responded as forcefully to the high domestic prices as they might have in the recent past. Even if they did, turning on additional gas supplies is not instantaneous. During the best of times there are lags for drilling and completing wells. But the market is also experiencing labor and equipment shortages, and upstream producers are still wary of sticking their necks out too far, even though prices right now are supportive. U.S. gas production is above this time last year, but still not back to pre-COVID levels, and as a consequence of the higher demand and lackluster supply, storage this year (black line, Figure 1) is well below the level from last year (orange line) and even the five-year average (blue line). So the U.S. gas market is not at a point of impending doom, but it’s certainly tighter than it has been in a while, and gas producers have shown restraint, despite the highest fall-time gas prices seen in 13 years. As a consequence, U.S. prices are reacting in an outsized way to movements in global gas prices.
About the song
"To the Moon and Back" was written by Darren Hayes and Daniel Jones (Savage Garden). It appears as the first song on the duo's debut album, Savage Garden. Released as a single in November 1996, the song went to #24 on the Billboard Hot 100 Singles chart. It went to #1 in the band's native Australia, according to the Australian Recording Industry Association (ARIA) Charts. Personnel on the record were: Darren Hayes (lead, backing vocals), Daniel Jones (keyboards, sequencing, guitars, vocals), Terepai Richmond (drums, percussion), Alex Hewetson (bass), Rex Goh (guitars), and Jackie Orzaczky (strings).
The Savage Garden album was recorded in Australia between 1995 and 1996, with Charles Fisher producing. Released in March 1997, it went to #3 on the Billboard Top 200 Albums chart. It has been certified 7x Platinum by the Recording Industry Association of America. The album won 10 ARIA Awards in Australia. Eight singles were released from the LP.
Savage Garden was an Australian pop duo formed in Brisbane, Queensland in 1993 by Darren Hayes and Daniel Jones. They released two studio albums, five compilation albums, and 14 singles. They have sold over 23 million records worldwide. The duo disbanded at the end of 2001, with Darren Hayes continuing as a solo artist. As a solo act, he has released four studio albums, one compilation album, one soundtrack album, and 17 singles. He currently resides in Los Angeles. Daniel Jones now runs a music production company and lives in Las Vegas.