Ever since US crude production began to increase in 2009 after 40 years of decline from its peak in 1970, refineries have been processing higher crude volumes. This summer (2014) crude processing volumes have been higher than at any time since the Energy Information Administration (EIA) began keeping records in 1982. Abundant supplies of reasonably priced crude in all regions as well as low refinery fuel costs are giving US refiners good reason to crank up their output. So much so that in the Midwest refinery output reached over 100 percent of capacity early in July. Today we describe the refining bonanza and how things might change in the not too distant future.
During the week ending July 11, 2014, US refineries processed 16.6 MMb/d of crude - the highest level ever recorded by EIA. [Data released yesterday by EIA indicates they processed marginally less crude – 16.5 MMb/d during the week ending July 25.] Figure #1 shows weekly refinery crude inputs as reported by EIA with the red trend line indicating growing volumes processed every year since 2009. This increase in refinery processing comes at a time when domestic demand for refined products produced by refineries has actually been declining due to two main factors – (1) renewable fuel standards replacing gasoline with ethanol and (2) greater auto fuel economy. So increased refinery output has reduced imports and increased exports of finished refined products (see Baby You Can Drive My Exports). Also note from the chart that crude processing is seasonal with most output occurring in the summer months and that refinery maintenance reduces processing in the spring and the fall (see Turn Around – Every Now and Then They Need a Little Bit of Maintenance). So although we could see that 16.6 MMb/d processing record topped again this August it is quite possible that the peak has already been reached this year.
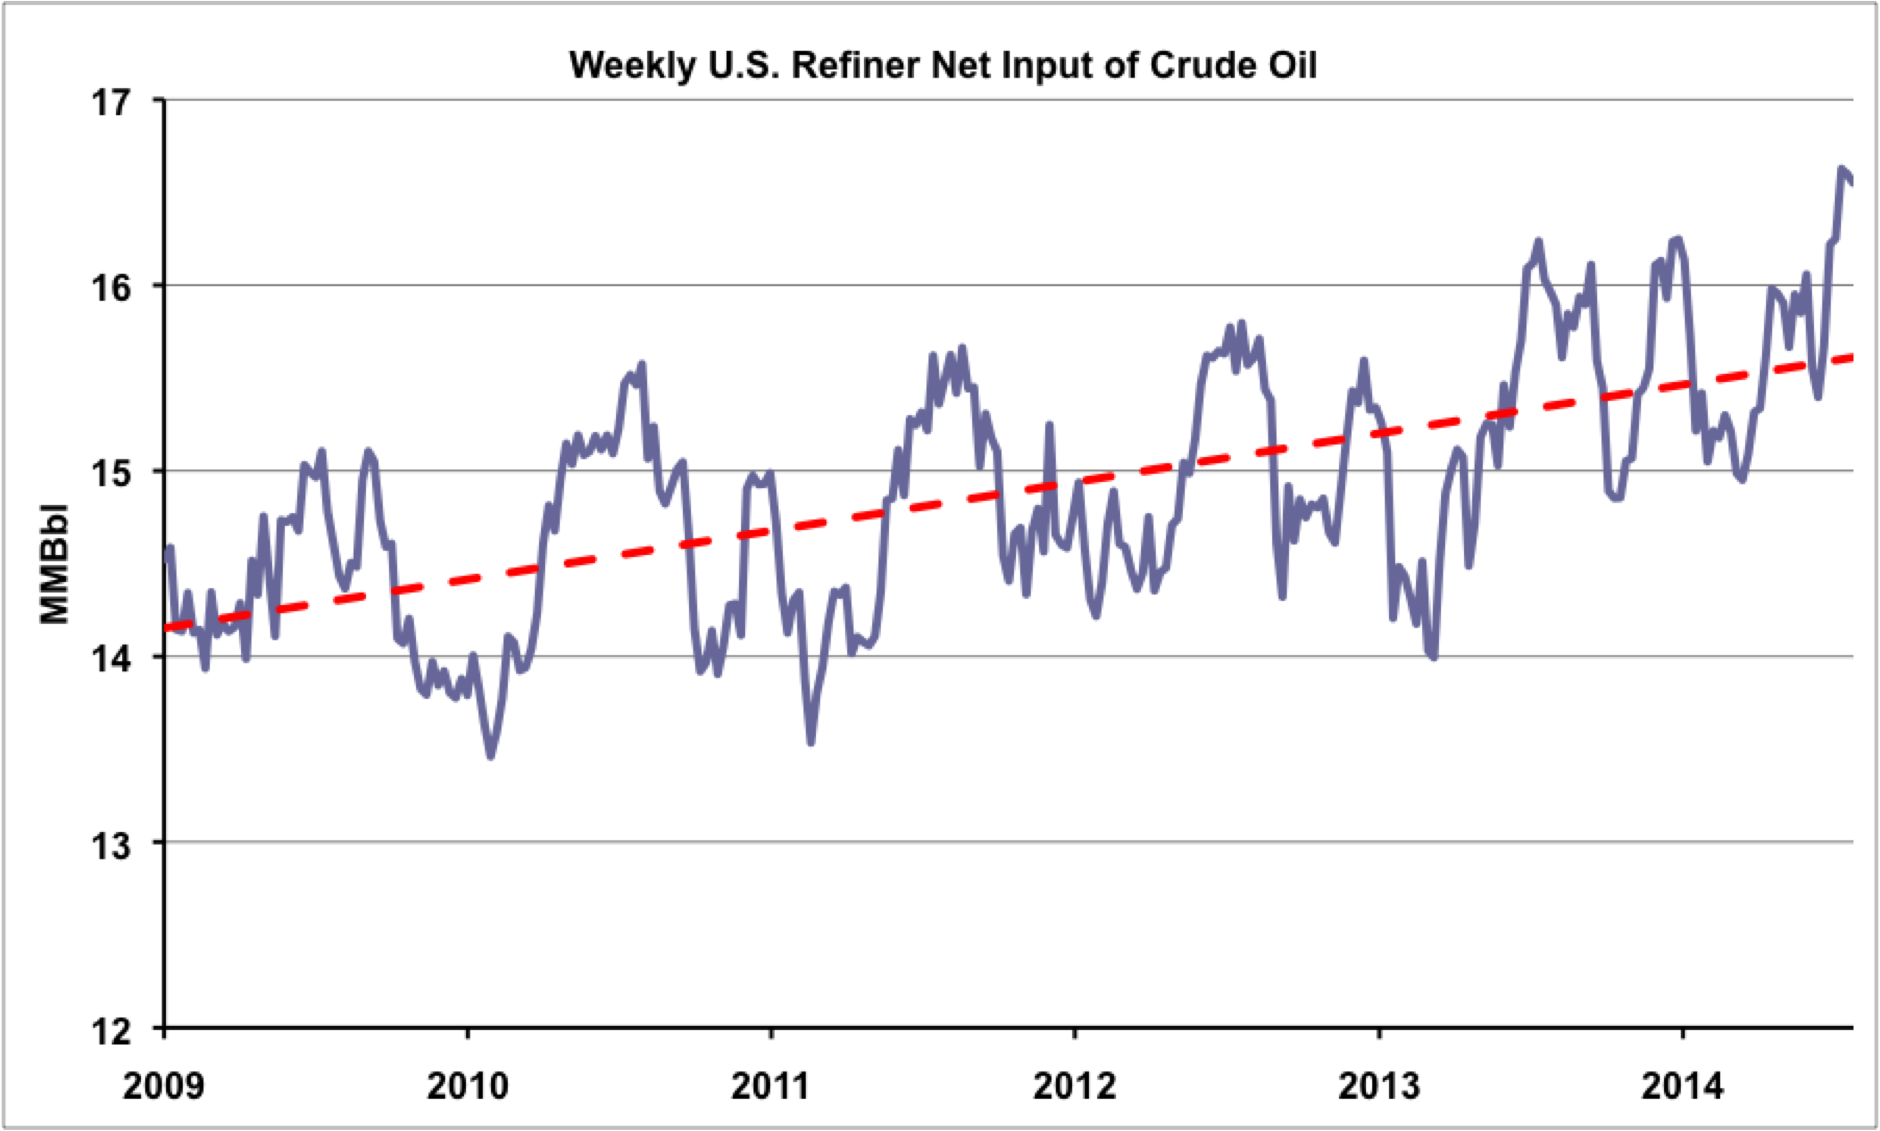
Figure #1
Source: EIA (Click to Enlarge)
And if you are not impressed by record levels of total US refinery processing then what about Midwest refinery utilization? That was over 100 percent for the week ending July 11, 2014 (back down to 97.4 percent for the week ending July 25). Yes – you read it correctly - EIA reported that Petroleum Administrative District for Defense (PADD) II refineries operated at 100.3 percent of nameplate capacity. How could that happen? The EIA explained in a recent “Today in Energy” post as follows:
“Refinery utilization is calculated based on calendar-day atmospheric crude distillation unit (ACDU) capacity, which takes into account usual operating conditions, including both planned and unplanned outages. Under ideal conditions, when outages are low, refiners can produce at levels above their calendar-day ACDU capacity.”
In fact Midwest refinery processing this year has been higher than the five-year average since April – the traditional start of the summer driving season, when gasoline demand increases and refiners finish their spring maintenance. To provide some insight into how Midwest refiners are incented to process more crude than usual this year, we looked at the crack spreads used as a benchmark by medium sized refiner PBF Energy at their Toledo refinery. We first looked at PBF’s Toledo operation back in December 2012 (see Masterpiece Refining – Part 2 Holy Toledo). The 170 Mb/d refinery runs on light sweet crude that is a mixture of West Texas Intermediate (WTI) supplied via Cushing, synthetic crude oil (a light crude upgraded from Western Canadian oil sands bitumen) and shale crude from the Bakken.
About the song
California Girls, written by Brian Wilson and Mike Love in 1965 featured the line “The Midwest Farmer’s Daughters Really Make You Feel Alright”