
March’s crude oil price crash hit the E&P sector like a tsunami, shattering capital and operating budgets, upending drilling plans, and eviscerating equity valuations. The initial responses by producers to the price collapse included a flood of capex reductions, corporate belt-tightening, and scattered production shut-ins. But first-quarter earnings reports issued in late April and early May provided the first detailed insight into the financial wreckage the crisis unleashed on U.S. E&Ps. It wasn’t pretty. The plunge in the WTI oil price to $20/bbl at the end of the first quarter triggered a combined $60 billion in impairments of oil and gas reserves across the 41 E&Ps we track, as well as a 16% decline in average revenue per barrel of oil equivalent (boe) from the pre-pandemic fourth quarter of 2019. More trouble may be ahead: the average oil price in the second quarter is on track for a 35% decline from the first quarter, which will dramatically impact the cash flows that allow companies to pay their staff, keep the lights on, and hold creditors at bay. Today, we analyze the first-quarter earnings results of our representative sample of U.S. producers and take a look forward to the potential effect of lower pricing on second-quarter earnings.
Before we dive into the numbers, it’s worth briefly reviewing the cost structure of U.S. E&Ps — a topic outlined in two blogs in April. First, in Eve of Destruction, we analyzed the costs of producing oil and gas, servicing interest on debt, and paying staff and office overhead for the 34 companies in our Oil-Weighted and Diversified E&P peer groups based on 2019 financial statements. Then, in Shelter from the Storm, we did the same with the nine Gas-Weighted E&Ps we follow. In both write-ups, we excluded impairment charges, income taxes, and exploration expenses that tend to be deferred when prices are low. For the Oil-Weighted and Diversified E&Ps, the average total cost was $28.82/boe of oil produced and the average cash cost (excluding depreciation, depletion and amortization costs, or DD&A) was $15.24/boe. Oil and gas companies rely on commodity price realizations in excess of these costs to fund capital expenditures and to return money to shareholders through dividends and share repurchases. We pointed out that steep reductions in capex, dividend cuts, and share repurchase programs were likely as commodity prices fell, with shut-ins of production from higher-cost wells likely if realizations dipped below the breakeven mark.
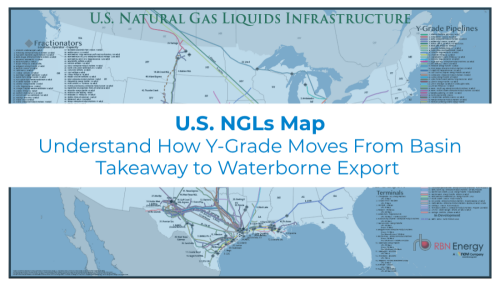
Visualize the infrastructure behind U.S. NGL movement.
The U.S. NGLs Map provides a comprehensive view of the transport, processing, and export networks moving NGLs across the U.S.
This thesis seems to have played out already, given the increasing severity of investment and operational reductions announced with first-quarter results. The latest quarterly data showed realizations of Oil-Weighted producers fell 12% to $32.85/boe and realizations of Diversified producers declined 19% to just $27.71/boe, slightly below the year-end 2019 breakeven point. Per-unit revenues of our total 41-company universe, including Gas-Weighted producers, were $25.58/boe, or about 16% lower than the $30.57/boe posted in the fourth quarter of 2019 and the lowest since 2016. Lifting costs came in at $9.65/boe, $0.37/boe below the fourth quarter, primarily because of a $0.27/boe decline in production taxes. DD&A expenses were down $0.03/boe to $11.88/boe. Exploration expenses, which do have some abandonments and unproved property impairments imbedded in that data, more than doubled, to $3.76/boe. Still, our universe of E&Ps reported pre-tax operating profits excluding impairments of only $354 million — barely in the black. The companies generated over $19 billion in cash flow during the first quarter of 2020 (red bar in Figure 1), or just under $16 for each boe produced. That’s lower than the average quarterly cash flow numbers of 2018 and 2019, but higher than those for the 2015-17 period.

About the song
“Spring Breakdown” was written by Luke Bryan, Ashley Gorley, and Zach Crowell. It appears as the fifth song on Luke Bryan's seventh Extended Play, Spring Break...Checkin' Out. Produced by Jeff Stevens, and released in March 2015, the EP went to #1 on the Billboard Top Country Albums, and #3 on the Billboard Top 200 Albums charts. An extended version of the EP with six extra songs was also made available. Since 2009, Bryan had been releasing EPs to coincide with spring break in the U.S. Personnel on the record were: Luke Bryan (lead vocals), Perry Coleman (backing vocals), J.T. Corenflos (acoustic, electric guitar), Kenny Greenberg (acoustic, electric guitar), Greg Morrow (drums, drum loops, percussion), Danny Rader (banjo, bouzouki, acoustic guitar), Mike Rojas (Hammond B-3 organ, piano, synthesizer), Jimmie Lee Sloas (bass), Jeff Stevens (acoustic, electric, gut string guitar), Jody Stevens (programming, synthesizer), and Ilya Toshinsky (acoustic guitar).
Luke Bryan is an American country music singer and songwriter from Nashville. He began his professional career as a songwriter, writing songs for Travis Tritt and Billy Currington. Bryan has released six studio albums, four compilation albums, seven EPs, and 31 singles; has had 26 #1 singles in the charts; and has sold over seven million albums and 27 million singles worldwide. He has won three Academy of Country Music Awards, two Country Music Association Awards, nine American Music Awards, and three Billboard Music Awards. Bryan still records and tours. His next album, Born Here, Live Here, Die Here, is scheduled to be released in August 2020. Tour plans are currently on hold due to COVID-19.