A raft of natural gas pipeline projects completed in the past couple of years has — for the first time — left room to spare on most takeaway routes out of the Northeast and provided Marcellus/Utica producers a reprieve from the all-too-familiar dynamic of capacity constraints and heavily discounted supply prices, even as regional production continues achieving new record highs. There’s on average close to 4 Bcf/d of unused exit capacity currently available — more in the winter when higher in-region demand means more of the production is consumed locally and less than that (but still more than in past years) in the spring, summer and fall seasons, when greater outbound flows are needed to help offset the relatively lower Northeast demand. But we’re expecting Northeast production to grow by another 8 Bcf/d or so over the next five years. And the list of projects designed to add more exit capacity has dwindled to just a few troubled ones that, even if built, wouldn’t be enough to absorb that much incremental supply. When can we expect constraints to re-emerge? Today, we conclude this series with a look at RBN’s natural gas production forecast for the Marcellus/Utica and how that correlates to the region’s pipeline takeaway capacity over the next five years.
For years, the Northeast’s gas flows and pricing dynamics have been defined by unrelenting production growth and takeaway constraints, with flows perpetually hitting capacity limits and supply-hub prices getting knocked down. But as we discussed in Part 1 of this series, after dozens of pipeline reversals, expansions and greenfield projects, takeaway capacity out of the region has finally caught up to — and is outpacing — Marcellus/Utica production growth. While the growth in the play’s natural gas output was modest in the first half of 2019, outright volumes are more than 4 Bcf/d above where they stood at this time last year and still setting records, with the monthly average exceeding 31 Bcf/d for the first time in June 2019. Yet, as a result of the excess pipeline capacity, June spot prices at Dominion South, Appalachia’s representative supply hub, were the strongest they’ve been in six years relative to national benchmark Henry Hub.
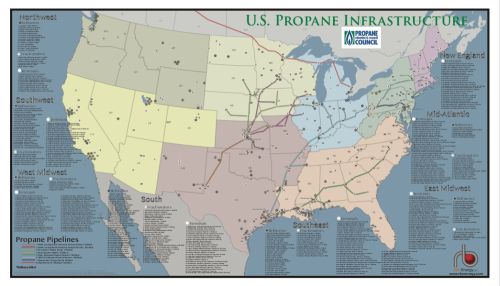
The RBN Energy U.S. Propane Infrastructure map provides a comprehensive view of the propane supply network in the lower 48 states.
To understand the fundamentals behind this new dynamic and its impact on prices, we took a detailed pipe-by-pipe approach to assessing flows, capacity and utilization rates on the various transportation outlets out of the Northeast (see Part 1 for a schematic of the outbound corridors as we define them). We started with the pipes heading to the Midwest and Canada (see Part 2), then in Part 3, we turned our attention to the pipes moving Marcellus/Utica gas to the Gulf Coast via the Ohio-to-Gulf and Southeast/Atlantic corridors. The overwhelming trend among these pipes is that just about all of them have seen upticks in capacity in the past few years as pipeline projects have been completed. Flows have trended higher as well — but not quite as much as capacity. As a result, overall pipeline utilization rates have declined.

About the song
“Room at the Top” was written by Tom Petty and appears as the first cut on Tom Petty and the Heartbreakers’ 10th studio album, Echo. The single of “Room at the Top” went to #19 on the Billboard Top Mainstream Rock Songs chart. Personnel on the song were: Tom Petty (lead and backing vocals, rhythm guitars, harmonica), Mike Campbell (lead guitars), Benmont Tench (piano, organ, Chamberlain, clavinet), Scott Thurston (rhythm guitars, backing vocals), Steve Ferrone (drums) and Howie Epstein (bass guitar, backing vocals).
Echo was released in April 1999 and was produced by Tom Petty, Mike Campbell and Rick Rubin. It went to #10 on the Billboard Top 200 Albums chart and was certified Gold by the Recording Industry Association of America. Three charting singles were released from the album. Mike Campbell sang lead vocals on the song “I Don’t Wanna Fight,” making Echo the only Tom Petty and the Heartbreakers’ album on which Tom Petty didn't sing lead vocals on every song. It was also the last Heartbreakers album to feature bass guitar and backing vocal contributions from Howie Epstein, who left the band during its recording because of a heroin addiction.
Tom Petty and the Heartbreakers were an American rock band with roots in Gainesville, FL; the band officially formed in Los Angeles in 1976. They made 13 studio albums, three live albums, six compilation albums and 24 singles. Tom Petty and the Heartbreakers won two MTV Video Music Awards and were inducted into the Rock and Roll Hall of Fame in 2001. Howie Epstein died in 2003, and Tom Petty passed away in 2017, putting an end to the Heartbreakers. Lead guitarist and songwriter Mike Campbell has released three studio albums with his band, The Dirty Knobs, since that time.