The 43 U.S. exploration and production companies (E&Ps) we’ve been tracking racked up $160 billion in losses in 2015-16, but they turned things around in the first quarter of 2017, posting profits of $9.1 billion, or $9.12 per barrel of oil equivalent (boe), during that three-month period. At first glance, the second quarter might seem like a return to tough times; profits by the group fell more than 80%, to only $1.7 billion, or $1.71/boe. However, when $6.3 billion in impairments by ConocoPhillips — most of them tied to $16 billion asset sales and a write-down of the Australia Pacific LNG project — are excluded, second-quarter profits by our universe of Oil-Weighted, Diversified and Gas-Weighted E&Ps totaled $8.0 billion, or $8.02/boe, a decline of only 11.6% from the first three months of 2017. Today, we begin a review of E&P performance and profitability with a big-picture look at key elements of their income statements.
Monitoring the financial results of a large and diverse group of E&Ps over the long term is a good way to assess the health of the energy industry as a whole, particularly when you examine the details — the revenues, the costs and the impairments — that contribute to the bottom line. In Piranha!, our market study of 43 top U.S.-based E&Ps, we examined the strategies that E&Ps are adopting to thrive in a world of lower hydrocarbon prices. Of that universe of companies, 21 focus on oil (60%+ liquids reserves), nine are gas-weighted producers (60%+ natural gas reserves) and 13 are diversified producers. All major U.S. shale/unconventional plays are represented in the combined portfolios of these firms. In four blogs over the past month (beginning with Rock Steady), we reviewed in detail the changes in forecasted capital spending and production reported by our universe in their mid-year results announcements. Today, we begin our analysis of the profitability data compared with their reported first quarter 2017 results.
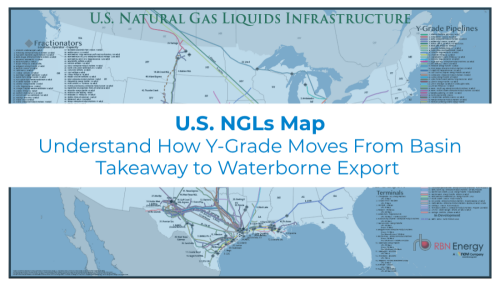
Visualize the infrastructure behind U.S. NGL movement.
The U.S. NGLs Map provides a comprehensive view of the transport, processing, and export networks moving NGLs across the U.S.
The prospects for E&Ps are ultimately linked to the swings of the crude oil and natural gas markets. Oil prices started 2017 at over $50/bbl, while natural gas prices started the year well over $3/MMBtu. The price for oil benchmark West Texas Intermediate (WTI), which averaged $52.50/bbl in January and $53.47/bbl in February, dipped below $50/bbl in March and reached a low for the year at $45.18/bbl in June. The $6.10/bbl decline in the average second quarter oil price resulted in lower pre-tax profits for E&Ps.
About the song
“Roller Coaster” was written by Michael Carter and Cole Swindell. It appears as the fourth song on Luke Bryan’s fourth studio album, Crash My Party. Released as a single in July 2014, it went to #1 on the Billboard Country Airplay chart and #43 on the Billboard Hot 100 Singles chart. It has been certified 2x Platinum by the Recording Industry Association of America (RIAA). Luke Bryan's merchandise manager, Cole Swindell, and his guitarist and bandleader, Michael Carter, wrote the song about the Miracle Strip Amusement Park in Panama City, FL, a place where they and Bryan had spent a lot of time in their youth. Personnel on the record were: Luke Bryan (lead vocals), J.T Corenflos and Kenny Greenberg (electric guitar), Ilya Toshinsky and Tom Bukovac (acoustic guitar), Mike Brignardello and Jimmie Lee Sloas (bass), Mike Johnson and Russ Pahl (steel guitar), Joe Spivay (fiddle), Shannon Forrest (drums), Mike Rojas and Charlie Judge (keyboards), and Perry Coleman, Tania Hancheroff and Jennifer Wrinkle (backing vocals).
Crash My Party was recorded in August 2013 at Capitol Studios in Nashville with Jeff Stevens producing. It was released the same month and went to #1 on both the Billboard Top Country Albums and Billboard 200 Albums charts. It has been certified 4x Platinum by the RIAA. Six singles were released from the LP.
Luke Bryan (Thomas Luther Bryan) is an American country music singer, songwriter and television personality. He began his professional career by writing songs for Travis Tritt and Billy Currington before signing as an artist with Capitol Nashville in 2007. Bryan has released seven studio albums, six compilation albums, eight EPs and 32 singles, 28 of which went to #1 on the Billboard country music charts. He has won five ACM Awards, six American Music Awards, five CMA Awards and five CMT Awards. From 2018 to the present, Bryan has served as a judge on the American Idol television talent show. He still records and tours and is currently on his Raised Up Right Tour in the U.S. He starts a two-week residency at the Theatre at Resorts World Casino in Las Vegas in November 2022.