There is no such thing as a typical NGL barrel. For example, the composition of y-grade production out of the Marcellus is significantly different from y-grade out of most of the Permian. And it is not just gas processing engineers who care. The make-up of an NGL barrel is inextricably linked to the value of that barrel. The reason is pretty simple: there’s a big difference in the value of each of the five NGL products. These days, natural gasoline is worth nearly eight times as much per gallon as ethane. Normal butane is worth 1.6X as much as propane. Consequently, the more natural gasoline and normal butane in your barrel versus the amounts of ethane and propane, the more the barrel is worth. So it’s important to anyone trying to follow the value added by gas processing and related infrastructure to understand where these numbers come from and how much the composition of a barrel can vary from basin to basin, or for that matter, from well to well. In Part 2 of our series on gas processing, we turn our attention to the variability in the mix of NGL production and its implication for processing uplift.
Part 1 of this blog series laid out a framework for the basic understanding of natural gas processing value creation, using the frac spread as the metric. Frac spread — the differential between the price of natural gas and the weighted average price of a typical barrel of NGLs on a dollars-per-Btu basis — is a rough-cut indication of the value added at gas processing plants by extracting NGLs out of the raw natural gas stream from the wellhead. We went through a frac spread history lesson to explain what the measure can tell us about cycles in the natural gas and NGL markets, and then we worked through an example using RBN’s basic frac spread Excel model. After touting all the exceptional insights that can be gleaned from looking at the frac spread over time, we then looked at the limitations of the frac spread model, including differences between the mix of NGL purity product components in the NGL barrel from one production area to another, and from one set of market conditions to another. Today, we’ll delve into the details of those issues, and along the way, we’ll point out some data quirks imbedded in the assessment of NGL production volumes.

Join Backstage Pass, your gateway to exclusive industry insights, connections, and resources across energy markets. Gain direct access to RBN's extensive archive covering crude oil, NGLs, LNG, natural gas, refined products, renewables, and energy transition.
NGL Barrel Composition
In our RBN frac spread model provided in Part 1, we used a “typical” wellhead NGL barrel composition of 42% ethane, 28% propane, 11% normal butane, 6% isobutane and 13% natural gasoline. So where do these percentages come from, and what makes them “typical”? Well, we’ve been using these numbers for a few years. They are based on Energy Information Administration (EIA) U.S. NGL production volume statistics from 2010 and 2011, which was a time before the Shale Revolution had started to significantly impact NGL markets. Ethane prices were high and ethane rejection (sale of ethane in the gas stream versus recovery as liquid ethane) was minimal, so the volumes reported by EIA accurately reflected wellhead production. Later, as ethane production overwhelmed demand, ethane prices dropped and massive rejection kicked in, EIA production volumes (which only report ethane actually recovered) no longer were reflective of the wellhead NGL barrel composition. Thus, we felt it was more accurate to use the pre-shale, minimal-rejection numbers.

About the song
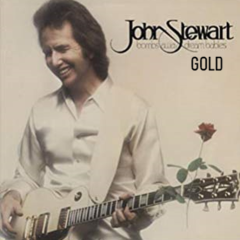
"Gold" was written by John Stewart and appears as the first song on Stewart's 10th studio album, Bombs Away Dream Babies. Released as a single in May 1979, the song went to #5 on the Billboard Hot 100 Singles chart. "Gold" features Fleetwood Mac's Stevie Nicks on harmony vocals. The song presents a lighthearted, cynical view of the music industry with its chorus of "people out there turnin' music into gold." In an ironic twist, Stewart later stopped performing the song in concert, claiming he had only made the song to make money and please his record company. To add to the irony, Bombs Away Dream Babies and the single "Gold" did not reach Gold status with the Recording Industry Association of America, despite being Stewart's most successful solo releases. Personnel on the record were: John Stewart (lead vocals, guitar, kalimba), Lindsey Buckingham (guitar, backing vocals), Joey Harris (guitar, backing vocals), Joey Carbone (keyboards), Bryan Garofalo (bass, backing vocals), Mike Botts (drums) and Stevie Nicks (backing vocals).
Bombs Away Dream Babies was recorded at Filmways, Wally Heider, Larrabee, and Village Recorders in Los Angeles during early 1979. Produced by John Stewart and Lindsey Buckingham, the album was released in May 1979, and went to #10 on the Billboard Top 200 Albums chart. A total of three singles from the album made it into the Top 40 charts, with "Gold" reaching the highest position at #5.
John Stewart was an American songwriter and singer. He started his career during the early ‘60s folk boom as a member of The Cumberland Three, and then, The Kingston Trio. His biggest hit as a songwriter was "Daydream Believer," which he penned for The Monkees; that became a #1 record for them in 1967. Stewart put out a staggering 67 solo records during his career. Many of these were live albums and collections of songs released on the prolific songwriter's own label. Stewart passed away in January 2008 at the age of 68.