
Crude oil prices are up more than $5/bbl over the past couple of weeks, mostly due to Middle East tensions and the latest readings of OPEC tea leaves. U.S. markets have contributed little to the bullish trend, with crude oil inventories hanging in there at 533.4 million barrels, just under the all-time record hit last week. U.S. production is up almost 800 Mb/d since the low last summer and a whopping 550 Mb/d since the OPEC/NOPEC deal. That’s some decidedly bearish statistics. If these trends hold, the U.S. could completely offset the 1.2 MMb/d in OPEC production cuts in another six months. But that begs the questions, where exactly do these statistics come from, and how should they be interpreted? The first answer is simple: it is the U.S. Energy Information Administration. But where do they get the numbers? And what can we learn about the crude oil market through a better understanding of the sources and assumptions behind these numbers? That is our topic in today’s blog.
This is Part 3 of a blog series in which we are examining the growing significance of the U.S. supply/demand balance in the Shale Era, as well as the data that are available to assess the balance on a regular basis. In Part 1, we discussed the relationship between crude oil prices and the U.S. supply/demand balance equation, focusing on what throws the equation out of balance, and what imbalances mean for crude oil prices. Part 2 took us into the math of EIA’s Weekly Petroleum Status Report (WPSR), the numbers released each Wednesday at 10:30 a.m. Eastern Time that include the latest on U.S. crude production; imports and exports; inputs and production at refineries and blending terminals; and inventories at refineries, terminals and pipelines, among other things. Using these data, the folks at EIA give us data to better understand the crude oil supply/demand balance.
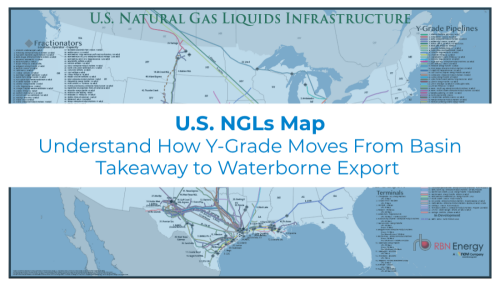
Visualize the infrastructure behind U.S. NGL movement.
The U.S. NGLs Map provides a comprehensive view of the transport, processing, and export networks moving NGLs across the U.S.
Figure 1 below shows the balance equation, in this case the averages for 2016. At the most simplistic level, the equation is “Production plus imports equals refinery runs plus exports.” Of course, there is one very important variable left out of this simple rendition of the equation: Inventories. It is the change in inventories that indicates just how out of balance the equation is over time. In Figure 1, production averaged 8.9 MMb/d during 2016 and imports came in at 7.9 MMb/d, for a total supply of 16.8 MMb/d. On the demand side, refinery runs averaged 16.2 MMb/d and exports 0.5 MMb/d, for a total of 16.7 MMb/d. That meant that last year about 0.1 MMb/d of crude oil (one hundred thousand barrels per day!) went into U.S. inventories each day last year. No wonder inventories kept hitting record levels.

About the song
“One Piece at a Time” was written by Wayne Kemp and appears as the second song on side one of Johnny Cash’s 54th studio album of the same name. The novelty song tells the tale of an auto worker at the Cadillac assembly plant in Detroit who puts a Cadillac together out of parts he has stolen from the plant for decades. The term “psychobilly,” describing a subgenre of rockabilly, comes from a lyric in the song. Released as a single in March 1976, it went to #1 on the Billboard Hot Country and #20 on the Billboard Hot 100 Singles charts. Personnel on the record were: Johnny Cash (vocal, acoustic guitar), Bob Wooten (electric guitar), Marshall Grant (bass), Larry McCoy (piano) and WS Holland (drums).
The album, One Piece at a Time, was recorded at House of Cash Recording Studio in Nashville in 1975-76 and produced by Charlie Bragg and Don Davis. Released in May 1976, it went to #2 on the Billboard Top Country and #185 on the Billboard 200 Albums charts. Two singles were released from the LP.
Johnny Cash was an iconic American country music singer and songwriter known as the “Man in Black.” He released 68 studio albums, 16 live albums, four soundtrack albums, 105 compilation albums, and 170 singles. He has sold more than 90 million records worldwide. He is a member of the Country Music Hall of Fame, Rock and Roll Hall of Fame, Gospel Music Hall of Fame, and the Rockabilly Hall of Fame. He has received Kennedy Center Honors and a National Medal of Arts. Johnny Cash died in Nashville in September 2003 at the age of 71.


Comments
A well written and informative piece today. I particularly enjoyed the history of its namesake!