Much like their upstream counterparts, midstream companies have shifted to fiscal conservatism over the past few years, focusing less on growth and capital investment and more on shareholder returns, acquisitions and debt reduction. But there are significant differences between the strategies of midstream companies set up as traditional corporations, or C-corps, and those established as master limited partnerships, or MLPs. In today’s RBN blog, we continue our short series on midstream company cash flow allocation with an analysis of their reinvestment rates vs. their shareholder payouts.
As we said in Part 1, companies in the midstream space have had to deal with significant changes both in tax law and in market realities prior to and during the Shale Era. The tax-related advantages once associated with MLPs waned with the 2017 cut in federal corporate taxes, for example, and the extraordinary infrastructure needs that came with the renaissance in U.S. oil and gas production led midstreamers to emphasize growth over shareholder returns. Our aim in this short blog series is to describe what the past five years have been like for midstreamers from a business and financial perspective. We determined that a good way to do that would be to examine the cash flow allocation of 13 large midstreamers with market caps of $10 billion or greater, about half of them traditional corporations and half MLPs.
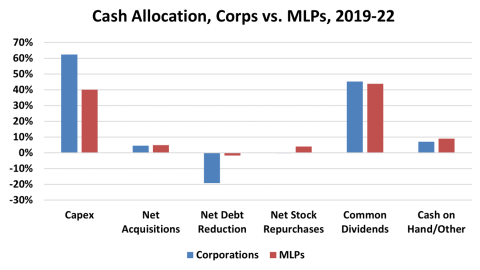
Generally speaking, midstream companies using a corporate entity structure were much more aggressive with their use of cash flow when compared with the MLPs. Corporations spent 62% (blue bar to far left in Figure 1) of their $221 billion in cash flow on capital spending between 2019 and 2022 vs. 40% for MLPs (red bar to far left). To support this more lavish spending, the companies relied heavily on borrowing. The C-corps borrowed $23.1 billion (19% of cash flow) between 2019-22 compared with $1.8 billion (2% of cash flow) for the MLPs.

Figure 1. Cash Allocation, C-Corps vs. MLPs, 2019-22.
Source: Oil & Gas Financial Analytics, LLC
Join Backstage Pass to Read Full Article


