
After years of oversupply conditions and pipeline constraints, the U.S. Northeast natural gas market is on the verge of reaching a point where it is unconstrained by transportation capacity and enjoys increased optionality for reaching growing demand markets downstream. There are no fewer than 20 pipeline projects in the works to facilitate that. If all – or even most of them get built, the region would develop the opposite problem — not enough gas to fill all that new pipe. Ultimately, the state of the Northeast market will come down to the timing of the expansions projects compared with the pace of production growth. Today, we conclude this series with a look at how supply will line up with pipeline expansion in-service dates over the next five years.
The transformation of the Northeast from primarily a gas taker to net gas supplier to the U.S. is reaching a critical turning point. In recent years, producers have been growing supply as fast as midstream companies can build the capacity for them to send it out. In Part 1 of this series, we looked at the Northeast’s supply-demand balance and the resulting surge of gas leaving the area, which has happened even as production growth slowed in the past 18 months or so. Now, with 20 more expansion projects due to come online by 2020, the questions arise: what will production do, and how will the two factors align in terms of timing?
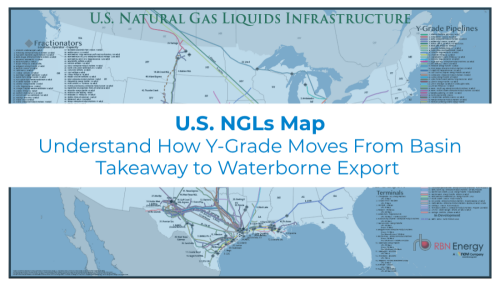
Visualize the infrastructure behind U.S. NGL movement.
The U.S. NGLs Map provides a comprehensive view of the transport, processing, and export networks moving NGLs across the U.S.
In subsequent episodes, we detailed midstreamer plans to add 17.5 Bcf/d of takeaway by 2020, including the four projects totaling 2.8 Bcf/d to the East (see Part 2); three projects adding 5.2 Bcf/d to the South via the Atlantic Coast (see Part 3); six projects for 4.0 Bcf/d targeting the Gulf Coast from Ohio (see Part 4); four projects totaling 5.0 Bcf/d to the Midwest; and two projects adding approximately 0.5 Bcf/d to Canada (Part 5). Then, in Part 6, we turned our focus to the outlook for Marcellus/Utica supply based on different price assumptions using the RBN Production Economics Model. Supply growth slowed dramatically in the past two years and rig counts fell to a low of just 35 rigs in mid-2016 across the Marcellus/Utica — including Pennsylvania, West Virginia and Ohio. But more recently, rig counts, have just about doubled since that low point. Additionally, the overall higher price environment this year and upcoming takeaway capacity additions suggest there is more upside to production in the near future. To understand the extent of that upside, we ran the model against four price scenarios for national benchmarks West Texas Intermediate (WTI) crude oil and natural gas index Henry Hub: the Advance, Growth, Cutback and Contraction scenarios with 2022 crude prices pegged at $80, $70, $60, and $50/bbl respectively, as described in Part 6.

About the song
"New York Minute" is a song written by Don Henley, Danny Kortchmar and Jai Winding and originally recorded by Henley for his 1989 album The End of the Innocence. The song was later covered by the Eagles on the Hell Freezes Over album released in 1994.