The West Coast energy market, PADD 5, is undergoing a profound transformation. Consumption of petroleum-based refined products is declining due to a host of factors including increased renewable diesel (RD) usage, slowing population growth, electric vehicle (EV) penetration and fuel efficiency improvements, just to name a few, but that’s only half the story. Further upping the stakes, crude oil production in the region has declined faster than downstream consumption, so it has had to increasingly rely on imported barrels to support its dwindling refinery throughput. In today’s RBN blog, we look at how the West Coast’s supply of refined products and crude oil has evolved over time and why its reliance on imports has grown.

Join us at our historic 20th School of Energy!
School of Energy: Foundations is a two day, in person conference designed to help energy professionals better understand the forces shaping crude oil, natural gas, NGLs, refined products, and petrochemicals.
Attendees will learn from RBN experts, work with Excel based analytical models, participate in Q&As, and network with industry peers.
Build the foundation to better navigate volatile energy markets.
In Part 1 of this series, we explained how the U.S. is divided into five Petroleum Administration for Defense Districts, or PADDs (see Figure 1 below). The East Coast’s population density makes it the largest consumer of refined products but, with no production to call its own, PADD 1 relies on imported crude oil to supply its shrinking refinery base. In Part 2, we put the spotlight on imports of Canadian crude oil and how critical they are to refineries in the Midwest and Great Plains. Most Canadian exports come through PADD 2 pipelines, and its 25 refineries (combined capacity of 4.3 MMb/d) are, in many cases, significant consumers of heavy and light crudes from the Great White North. In Part 3, we discussed the Gulf Coast — by far the biggest crude oil producing and refining market in the U.S. Its sheer size makes it critical in balancing crude oil and refined products markets, with its refineries being on average the most efficient in the world with ample export opportunities. Most recently, in Part 4, we addressed the importance of rising crude production from shale basins in and around the Rockies and how it has contributed to greater volumes being pushed toward the Cushing, OK, storage hub.
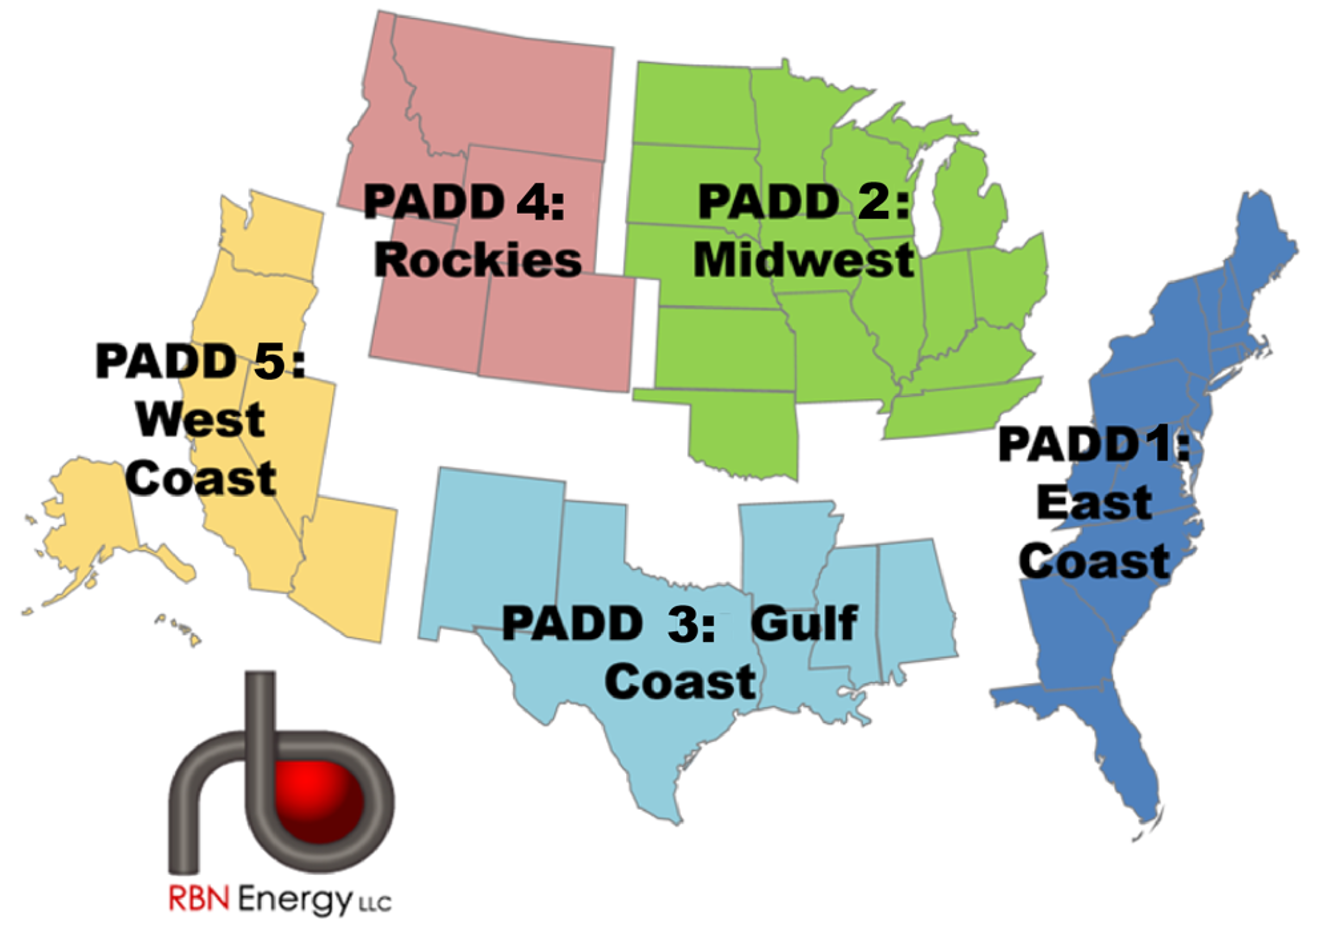
Figure 1. U.S. PADD Map. Source RBN
Today we finish off our series by focusing on PADD 5, which stretches from the island-studded waters of the Puget Sound to the sun-speckled glitz of Southern California and the deserts of Nevada and Arizona, with Alaska and Hawaii thrown in for good measure. The petroleum markets of PADD 5 are just as diverse as its geography, with plenty of refined product consumption to go around, although its 2.6 MMb/d of demand makes it the second-lowest consuming region in the U.S., way ahead of PADD 4 but behind PADDs 1, 2 and 3. The majority of the region’s population resides in California, which was once the nation’s largest oil-producing state following the discovery of oil in the San Joaquin Valley and Los Angeles in the late 1800s. Since the Shale Revolution unlocked the resource potential of other states, California has been left behind in terms of its significance as a producer, primarily due to a hostile regulatory environment that discourages investment, particularly in the petroleum sector. At the same time, crude oil production in Alaska has started to show its age, with output in the state experiencing a steady decline. This trend in Alaska may be about to reverse, as we noted recently in Take It On The Run, but PADD 5 will continue to lag behind all of the other oil-producing regions.
Keystone Crude Oil Pipeline Suffers Line Break in North Dakota
To gain a detailed understanding of PADD 5’s refined products markets and its prospects, check out the latest edition of the Future of Fuels report by RBN’s Refined Fuels Analytics (RFA) practice.

About the song
“(I Left My Heart) in San Francisco” has music that was written by George Cory and lyrics by Douglass Cross. it appears as the first song on side one of the album with the same title. It became Tony Bennett’s signature song. Released as the B-side of his single, “Once Upon a Time” in February 1962, it went to #7 on the Billboard Easy Listening and #19 on the Billboard Hot 100 Singles charts. It has been certified Gold by the Recording Industry Association of America and is one of the official anthems of the city of San Francisco. It is in the Grammy Hall of Fame and won Bennett a Towering Performance Award from the Songwriters Hall of Fame. Personnel on the record were: Tony Bennett (vocals), Ralph Sharon (piano), and Marty Manning (orchestra arrangements and conducting).
The album, (I Left My Heart) in San Francisco, was recorded between October 1957 and January 1962 at CBS’s 30th Street Studio in New York City with Ernie Altschuler producing. Released in June 1962, the album went to #5 on the Billboard 200 Albums chart and remained on the charts for 149 weeks, making it one of Bennett's best-selling albums. It has been certified Platinum by the RIAA. One single was released from the LP.
Tony Bennett (Anthony Dominick Benedetto) was an American jazz and popular song singer. He started his professional career in the 1940s and released his first single, “Because of You,” in 1951. He released 61 studio albums, 11 live albums, 33 compilation albums, an EP, and 83 singles. He has sold more than 50 million records worldwide. He won 20 Grammy Awards, a Grammy Lifetime Achievement Award, Kennedy Center Honors, two Primetime Emmy Awards, a National Endowment for the Arts Jazz Master Award, and has a star on the Hollywood Walk of Fame. He also had success as a painter and has been exhibited at various galleries around the world. Bennett died in New York City in July 2023 at the age of 96.