The Trump administration’s approach to economic policy — including tariff threats to longtime allies backed by sometimes shifting policy goals — might be a sound tactical move in the long run by keeping negotiators on edge and extracting better deals. But that approach has also heightened the sense of uncertainty about where things are headed, affecting investment and long-term planning. In today’s RBN blog, we discuss how economic policy uncertainty has increased in the past few months and how it’s impacting activity in the energy sector.

The term economic uncertainty has been at the top of everybody’s mind recently. Even though U.S. tariffs have exempted most energy imports and there has been little market impact so far from Chinese tariffs on U.S. energy products, much of the energy industry has slowed decision-making on large new investment and is proceeding cautiously on just about every consequential project, just like the rest of the economy. While energy-related projects may not feel the effect of tariffs to the same degree as other sectors of the economy, the feeling of uncertainty is widespread. So, how do we assess the current situation and the impact of this slowdown?
Economic uncertainty and its impacts can be hard to quantify, but there are some measures, including the Economic Policy Uncertainty (EPU) Index, which provides a 50,000-foot view of where things stand and is calculated by researchers from Northwestern University, Stanford University and the University of Chicago. The U.S. version of the index has three underlying components. The first is an index of search results from 10 major newspapers, including the New York Times, Wall Street Journal and Washington Post. Researchers track the volume of news articles discussing economic policy uncertainty.
The second component draws on reports by the Congressional Budget Office (CBO) that list temporary federal tax code provisions, giving a measure of uncertainty regarding the path that the federal tax code will take in the future. The third component draws on the Federal Reserve Bank of Philadelphia’s Survey of Professional Forecasters. Here, researchers examine the differences between individual forecasters’ predictions about the Consumer Price Index (CPI), federal spending, and state and local expenditures to measure macroeconomic uncertainty.
Using those three components, the index is designed to have an average score of 100 (solid red line in Figure 1 below), with scores above that indicating a higher-than-average level of uncertainty and lower scores suggesting less. The index tends to jump during certain events — including wars, tight presidential elections and financial crises — but policy uncertainty has become more volatile since the Great Recession (green arrow), with notable spikes related to the 2011 debt-ceiling dispute (purple arrow), the pandemic and the runup to the 2020 presidential election (blue arrow).
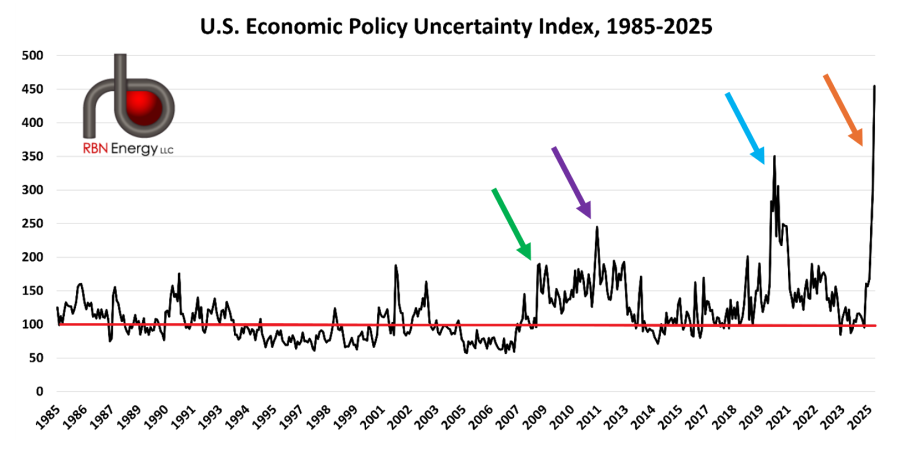
Figure 1. U.S. Economic Policy Uncertainty Index, 1985-2025. Source: policyuncertainty.com
Join Backstage Pass to Read Full Article