A key supply/demand balancing mechanism in the U.S. Northeast natural gas market – displacement of flows – is about to be history, at least in the summer months. With regional supply close to 4 Bcf/d higher year-over-year and now fewer options for offsetting the supply growth, the region faces significant downside risk for prices and even production this summer. The question is, can regional storage, demand and outflow capacity help prevent a widespread summer 2015 supply glut? Today we look at prospects for balancing the surplus in the region, starting with storage and demand.
Recap
In Part 1, we showed how Northeast natural gas production growth thus far has been accommodated by pushing out (i.e., displacement of) traditional supply flows into the region. As of this summer that buffer will largely have run its course, as inflows are expected to drop to near zero. This is a critical turning point, because without inflows to displace and with limited outflow capacity available, the Northeast will be left with fewer options for absorbing the year-over-year supply growth expected this summer. Any resulting surplus can be expected to exert severe downward pressure on already low prices until either new demand materializes or production is curtailed. How low gas prices get this summer will depend on how easily demand in the region can balance against the supply growth. We’ll begin that analysis this time by looking at the role of storage and new sources of demand in the Northeast. We’ll cover outflow capacity from the region next time.
The gas market balance in the Northeast region is made up of production, inflows and LNG imports on the supply side, and power burn, industrial, residential/commercial demand (consumption), outflows and storage on the demand side. On the supply side, we calculated in Part 1 that even if production were to remain flat to current levels this summer, there would still be a net 3.5 Bcf/d more supply in the region this summer versus last. As a result, the demand side of the equation needs to increase by this same 3.5 Bcf/d versus last summer to balance the market, either by injecting more into storage, consuming more in the region, sending more out of the region or a combination of all three. Of course, we can’t know for sure exactly how the fundamentals will shake out this summer. But using historical data and recent trends, we can prognosticate where the excess gas supply can go and how much breathing room there is.
Storage
One of the ways the Northeast gas market could absorb more supply than last year is by increasing injections into regional storage fields over the summer (April through October). But to help offset year-over-year production growth, injections into storage this summer would have to average higher than last summer, and by our calculations, this would be a tall order. To start with, total injections last year were near record-highs at 789 Bcf; and storage levels started the 2015 injection season about 100 Bcf higher than last year in the northeastern states, according to Energy Information Administration (EIA) montly state-level data for working gas in storage. That doesn’t leave much room for increasing gas into storage this summer. Figure 1 shows EIA historical storage estimates for Northeast states by month (blue area) and projected inventory levels for summer 2015 to the right. The projections are based on two scenarios: (1) that we inject as much as last year (dark gray area); and (2) that we inject to full capacity (dark gray plus light gray area). The black line represents the highest observed October-ending inventory of about 1,060 Bcf seen in 2012 – that is about where storage would end up if the Northeast injects as much as last year from April through October. The red line represents EIA’s estimate of the total working gas capacity available in the Northeast states – a level that has never actually been tested before. If storage levels get to the red line that would represent an addition of 100 Bcf over last year or 0.5 Bcf/d – still well short of the 3.5 Bcf/d the market needs to balance.
About the song
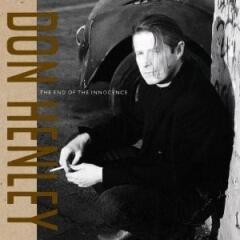
“The End of the Innocence” was written by Don Henley and Bruce Hornsby. It appears as the first song on Don Henley’s third solo studio album of the same name. It was produced by Don Henley and Bruce Hornsby and released as a single in June 1989. It went to #1 on the Billboard Album Rock Tracks chart and #8 on the Billboard Hot 100 Singles chart. The song won a Grammy Award for Best Rock Vocal Performance at the 32nd annual Grammy Awards in 1990. Personnel on the record were: Don Henley (vocals, drums), Bruce Hornsby (acoustic piano, keyboards), Jai Winding (keyboard bass), Michael Fisher (percussion), and Wayne Shorter (soprano sax solo).
The album The End of the Innocence was recorded in 1987-89 at A&M Studios and The Complex in Los Angeles. It was produced by Don Henley, Bruce Hornsby, Mike Campbell, John Corey, Danny Kortchmar and Stan Lynch. Released in June 1989, it went to #8 on the Billboard 200 Albums chart and has been certified 6x Platinum by the Recording Industry Association of America. Five singles were released from the LP, three becoming Top 40 hits.
Don Henley is an American singer, musician, songwriter and record producer who is a founding member of the rock band The Eagles. He released his first studio album with the band Shiloh under the tutelage of Kenny Rogers in 1970. He met Glenn Frey in Los Angeles and they toured together in Linda Ronstadt’s band in 1971. Later that year they put together the original version of The Eagles with Randy Meisner and Bernie Leadon and released their debut album in 1972. The Eagles broke up in 1980 and Henley embarked on a solo career then. The Eagles reunited in 1994 with Henley again on board. As a solo artist, Henley has released five studio albums, two compilation albums and 27 singles. As a member of The Eagles, he released seven studio albums, three live albums, 10 compilation albums and 30 singles. The Eagles have sold more than 200 million records worldwide. As a solo artist, Henley has won two Grammy Awards and two MTV Video Music Awards. As a member of the Eagles, he has won six Grammy Awards; was inducted into the Rock and Roll Hall of Fame and Vocal Group Hall of Fame; and received Kennedy Center Honors. He continues to record and tour and will be appearing with The Eagles at The Sphere in Las Vegas from December through March 2025.