Natural gas production in the Gulf of Mexico (GOM) has been falling for 15 years, hurt first by hurricane-related rig damage, then more recently by the side effects of the BP/Macondo disaster, the on-shore sale boom, and the resulting sag in gas prices. But GOM gas production is about to uptick, due largely to two big, long-planned oil and gas projects finally coming online. Is the upcoming increase in gas production in the Gulf the first sign of resurgence, or is it the energy-sector equivalent of a “dead cat bounce.” In this blog, we consider what is ahead for gas production in the GOM.
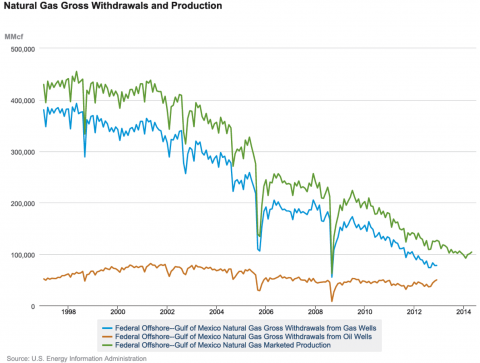
The few of us old enough to remember the Houston Astros winning more than 100 games in a season (it has only happened once, in 1998, and as of late July is mathematically impossible in 2014) also can recall a time when wells in the GOM produced a significant portion of US natural gas needs. In 1998, total GOM gas production marketed averaged more than 14 Bcf/d (see the green line in Figure #1), according to the US Energy Information Administration (EIA), providing 23% of the 61 Bcf/d the US consumed that year. Fast-forward to 2013. US gas consumption was up 17%, to 71 Bcf/d, but GOM gas production was way down—off 71% to 3.6 Bcf/d. Two deep valleys in the graph in Figure #1 tell much of the tale. First, in the summer and fall of 2005, two major hurricanes—Katrina and Rita—wreaked havoc on gas (and oil) infrastructure in the Gulf; then, three years later, hurricanes Gustav and Ike did serious damage of their own. Yet another big hit to GOM gas production came in the aftermath of the BP/Macondo blowout in April 2010, which brought well permitting to a halt and slowed exploration activity. But perhaps the biggest hit of all came from the boom in the production of onshore shale gas, which rose from 5.5 Bcf/d in 2007 to 28 Bcf/d in 2012. In July 2014, the Marcellus region alone produced 15 Bcf/d, several times the Gulf’s total production. The shale boom resulted not only in ample gas supply and lower, more stable gas prices, but also in gas production nearer to consumption population centers. The model of piping GOM, Louisiana and Texas gas to the Northeast, for example, is now a thing of the past (see They Long to Be Close to You).
Figure #1
Source: Energy Information Administration (EIA - Click to Enlarge)
One other thing worth noting about Figure #1 is that the real driver in the amount of gas produced and marketed (green line) has been gas withdrawn from gas wells (blue line)—that is, wells that primarily produce gas. Associated gas from oil wells (orange line) has historically been much less important though in the last two or three years it has come to account for a significant share of the total. More on that in a bit.
Join Backstage Pass to Read Full Article


