The crude oil market may be approaching another rough patch, with the trajectory of the COVID pandemic and OPEC+ again poised to inflict a double whammy on U.S. producers. For the past couple of months, refinery demand for crude has been rebounding as the U.S. has made tentative steps toward reopening. Over the same period, domestic production of oil declined and then flattened out, and now appears to be headed for a midsummer uptick as more shut-in wells are brought back online. But there’s potential trouble just ahead. The months-long imbalance between crude supply and demand boosted U.S. oil inventories in commercial storage to record-high levels over the past few weeks, with even more oil flowing into rented space in the Strategic Petroleum Reserve (SPR) salt caverns. Worse yet for producers, a resurgence of the coronavirus may put some parts of the U.S. back into semi-lockdown, and if that happens, refinery utilization could take a second tumble. That could push more crude into storage or onto supertankers for export, even as OPEC+ is talking about relaxing their production cuts. Today, we examine the trends that could be problematic for U.S. oil producers and refiners in the second half of 2020 and beyond.
Like many a 25-year-old guy or gal eager to head out with friends for tacos and beers, U.S. producers and refiners would like nothing more than for life to get back to normal — the way things were just a few months ago. Producers long for $55/bbl WTI and easy pipeline access to key markets; refiners, for 90% refinery utilization rates and respectable refining margins. However, the reality is that COVID is hanging around and spreading in many parts of the U.S. and there’s a real possibility that the quick return to normal that all of us have been hoping for may not come to pass. It may take time, and crude-focused producers and refiners may be in for another round of angst.
We’ve tracked the ever-evolving impacts of the coronavirus on oil and gas markets for a few months now, beginning with Free Fallin’, a March 1 blog in which we noted that crude prices were in a nosedive. (And were they ever!) A couple of weeks later, WTI was spiraling down toward $20/bbl, and the crude market was in steep contango, with much higher forward prices pulling large volumes of crude into Cushing and other storage to keep the market in balance (see Save It for Later). The driving force behind the price collapse was falling demand for crude from refiners, who were responding to COVID-related demand destruction — that is, the collapse in the use of transportation fuels as stay-at-home orders kicked in — something we discussed in Things That Matter. This got worse, of course. As crude-market folks will surely tell their grandchildren someday, WTI traded at a negative $37.63/bbl on April 20 — the first time anything like that had ever happened — but that anomaly was mostly tied to the mechanics of futures contracts and how they transition from month to month. Further, in Shut Down, Dakota, and Whistler and Fish, we discussed the complicated decision-making around shutting in wells and the curtailments that producers in the Bakken and the all-important Permian quickly implemented in response to super-low prices.
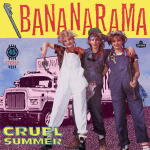
The multi-colored Figure 1 illustrates how much crude oil demand and supply have been shifting since the start of 2020, and especially since mid-March, when the demand-destructive effects of COVID kicked in with a vengeance. All the numbers on this graphic are from the Energy Information Administration’s (EIA) Weekly Petroleum Status Report. The foreground bars show the supply side of the market equation, with the patterned blue segments showing U.S. crude oil production and the patterned orange segments showing imports. (Note that the y-scale slices 10 MMb/d off the bottom to make the changes more readable.) The background areas show the demand side: namely, refinery runs (aqua layer) and exports (brown layer). The difference between supply and demand represents volumes in and out of storage and EIA’s “balancing item,” a statistic formerly known as “unaccounted-for crude oil.” (You can see why they changed the name.)
Figure 1. U.S. Crude Supply and Demand to Date in 2020. Source: EIA
Before we delve into the details, note in Figure 1 that both crude oil supply (again, the bars) and demand (the layers) held steady through the first two and a half months of 2020 and remained in relative balance. It was only in mid-March, when U.S. stay-at-home orders and other effects of the coronavirus kicked in, that all hell started breaking loose. For most of the past three-plus months, crude supply has exceeded demand by a considerable margin, as evidenced by all the supply bars in the right half of Figure 1 poking well above the tops of the demand layers. That “surplus” crude went into storage, spurring the fastest build-up in U.S. crude inventories since the EIA began keeping track of the numbers in the early 1980s.
U.S. crude production began 2020 at 12.9 MMb/d and stayed no more than 100 Mb/d above or below 13 MMb/d through the last week of March, when producers — responding to lower refinery demand and lower prices — slashed their drilling programs, simultaneously initiating well shut-ins and choke-backs. By the end of April, production had fallen to about 12 MMb/d, and by the end of May, it was headed toward 11 MMb/d. In mid-June, U.S. crude output bottomed out (at least for now) at 10.5 MMb/d, with Tropical Storm Cristobal taking a bite out of production for a week, but it quickly rebounded to 11 MMb/d, where it has stayed for the past three weeks. In a moment, we’ll get to where we think crude production may be headed next.
As for crude imports (again, patterned orange bars), they held relatively steady through the end of March at between 6 MMb/d and 7 MMb/d, then roller-coastered to as low as 4.9 MMb/d in mid-April and as high as 7.4 MMb/d in late June/early July.
The demand side experienced big shifts as well, most of them tied to the massive decline in refinery runs that gathered steam in the second half of March. Refinery demand for crude (aqua layer) started 2020 at just under 17 MMb/d, when the refinery utilization rate was riding high at 93%. Refinery runs dipped no lower than 15.7 MMb/d through the first half of March, but then began a precipitous and historic collapse to only 12.4 MMb/d by early May, by which time the utilization rate had fallen to less than 68%. The culprit, of course, was sharply lower demand for jet fuel and gasoline; diesel demand fell less — trucks and locomotives were still needed to deliver food and other essentials, even during the peak of the economic and social lock-down. By early July, refinery runs had rebounded to 14.3 MMb/d and utilization rates were topping 77% –– far from normal still, but at least closer to it.
Crude exports (brown layer) generally held up through the spring, though there were a lot of ups and downs along the way. Export volumes started January at just under 3.1 MMb/d, then increased to as much as a record 4.4 MMb/d in mid-March and fell to as little as 2.4 MMb/d in late June/early July. But the average has held in there, at 3 MMb/d since April 1.
As we said earlier, the imbalance between crude supply and demand that continued from mid-March through early July resulted in the fastest build-up in U.S. crude inventories since 1982 (and probably ever). Over that 15-week period, the crude put into storage — either at commercial facilities or the federal government’s SPR — totaled 106 MMbbl, which works out to an average of 920 Mb/d, or about 8% of current U.S. production. Commercial storage volumes (black line in Figure 2) rose by 85 MMbbl over that period, from 455 MMbbl to 539 MMbbl, or roughly 80% of the U.S.’s 672 MMbbl of working commercial storage capacity (red line), according to EIA; most of the gain came in the March-through-May period (dashed purple oval). That 539-MMbbl level is only 2 MMbbl off the all-time record storage level hit on June 19 (blue arrow). Stored volumes in the SPR (not shown), in turn, increased by 21 MMbbl from mid-March to early July, from 635 MMbbl to 656 MMb/d, or about 92% of SPR’s stated capacity.
Figure 2. Commercial Crude Inventories. Source: EIA
So, where is all this headed for the rest of 2020 and into 2021? On the U.S. crude production front, our expectation — as we hinted at earlier — is that production will bump up by a modest amount over the next month or two as more of the wells that were shut in this spring are restarted. However, given the big pullback in producers’ capital spending and, with it, the rig count and their anemic plans for drilling and completion activity, we anticipate that production will sag through the last four months of this year into at least mid-2021 as the natural decline in output from existing wells exceeds production gains from the few newly completed wells.
The big unknown is whether the recent surge in confirmed coronavirus cases, mostly across the southernmost third of the U.S., will result in a major interruption of the economic reopening that has been underway since May. If the hardest-hit cities and states pull back and economic activity sags again, we may well see refinery utilization rates remain below 80% for a while. That would keep refinery demand for crude at levels well below what had been the norm until COVID hit the U.S., exacerbating the imbalance in supply and demand and resulting in another round of record surpluses.
If it plays out this way, the good news is that the crude market has a couple of relief valves this time around. First, most of the inventory imbalance has gravitated to the Gulf Coast, with inventories at Cushing, the epicenter of the April debacle, now down nearly 18 MMbbl, or 30%, from their April peak. There also is 140 MMbbl of storage capacity still available in PADD 3 (the Gulf Coast) that can be used to soak up some of the surplus.
The second balancing mechanism available is exports. As noted above, U.S. exports have averaged 3 MMb/d since April 1, well below maximum available export capacity. In our How Much More Can She Stand blog series, crude export capacity along the Gulf Coast was estimated at 5.1 MMb/d in mid-2019, and that capacity has risen since, with the Louisiana Offshore Oil Port (LOOP) ramping up its capabilities; three new terminals along Corpus Christi’s Inner Harbor coming online; and the new South Texas Gateway Terminal in nearby Ingleside, TX, about to begin operations. So if there is too much crude oil on the Gulf Coast, it can make its way to the water.
Of course, the big question then is whether the world market can absorb the surplus. On the demand side, if you believe the most recent International Energy Agency’s (IEA) Oil Market Report (OMR), the answer is, “probably.” The IEA bumped up its outlook for 2021 demand slightly and remains relatively bullish on the prospects for 2021, with world oil demand expected to increase by 5.3 MMb/d. But the supply side may not cooperate, because now we have OPEC+ getting ready to bring more production online. Based on reports over the weekend, it looks like members of OPEC+ are contemplating a 2-MMb/d easing of their 9.7 MMb/d in current production cuts. In other words, OPEC+ will likely want to supply a big share of any rebound in global demand.
The bottom line is that there are a lot of moving parts in this equation, any one of which could derail the improvement we’ve seen over the past few weeks in the U.S. crude oil market. More than ever, it’s important to pay close attention to all the statistics and relationships to make sense of it all. And that’s our lead-in to today’s self-serving promotion. (Please stop reading now if you wish to avoid a brief advertisement.)
RBN has three publications that follow the major trends explored in this blog. The first is Crude Oil Gusher, a weekly crude oil report that provides data and reasoning behind U.S. crude oil markets. In it, we analyze EIA’s weekly production, demand, storage, and imports/exports numbers and assess what the data implies for prices.
Crude Voyager is a weekly analysis of U.S. Gulf Coast crude oil loading activity that assesses the ebbs and flows of crude loadings, destinations, and geopolitical issues impacting U.S. exports. The report outlines the major paths for laden tankers hauling U.S. crude all over the world and covers the change in tanker departures to the main regions that consume U.S. oil exports.
Crude Oil Permian, finally, provides detailed analysis of the fundamental drivers impacting the Permian Basin crude oil market, including weekly updates of Permian crude oil supply and demand, pipeline outflows and capacity, prices, and infrastructure updates.
For details on free trials and pricing, or to subscribe to any of these publications, please email TJ Braziel at tjbraziel@rbnenergy.com.
“Cruel Summer” was written by Tony Swain, Steve Jolley, Siobhan Fahey, Sara Dallin, and Keren Woodward. It appears as the first song on Bananarama's second studio album, Bananarama. The song was originally released as a single in June 1983, but it wasn't until its re-release after its inclusion in the movie The Karate Kid in July 1984 that the song became a hit in the U.S. It went to #9 on the Billboard Hot 100 Singles chart, making it the first Top 10 U.S. record for Bananarama. Ace of Base covered the song in 1998, and their version went to #10 on the singles chart. Personnel on the Bananarama record were: Sara Dallin (vocals), Siobhan Fahey (vocals), and Keren Woodward (vocals).
The Bananarama LP was recorded between April 1983 and February 1984. Produced by Tony Swain and Steve Jolley, the album was released in April 1984. Five singles were released from the album, which went to #30 on the Billboard Top 200 Albums chart.
Bananarama is an English female pop music trio formed in London in 1981 by friends Sara Dallin, Siobhan Fahey, and Keren Woodward. The group has released 11 studio albums, 13 compilation albums, and 45 singles. Siobhan Fahey left Bananarama in 1988 to form the duo Shakespears Sister with Marcella Detroit (Marcy Levy). Jacquie O'Sullivan joined Bananarama from 1988 to 1992. After her departure, the group continued as a duo with Dallin and Woodward. Fahey rejoined the group for an original-members tour in 2017, after which the group returned to being a duo. Dallin and Woodward released the latest Bananarama studio album, In Stereo, in April 2019. The group still records and tours, with touring plans on hold due to COVID. Dallin and Woodward will be publishing a memoir of their time in Bananarama, called Really Saying Something, in October 2020.