U.S. oil and gas producer share prices got a nice boost in mid-April from the Chevron/Occidental Petroleum bidding war for Anadarko Petroleum, which sold for more than a 40% premium to its price before Chevron’s opening bid. But the optimism was only temporary; the S&P E&P stock index has since retreated 13% to mid-February levels, during a month in which companies released their first quarter 2019 earnings reports. That suggests that, despite a 38% quarter-on-quarter increase in the pre-tax operating profit of the 44 E&Ps we track, investors found nothing in the first quarter results to dispel the generally negative sentiment that has hung like a dark cloud over the oil and gas industry since late 2014. Today, we analyze the first quarter financial performance of our 44 E&Ps and review the outlook for an industry ripe for further consolidation because of depressed equity valuations.
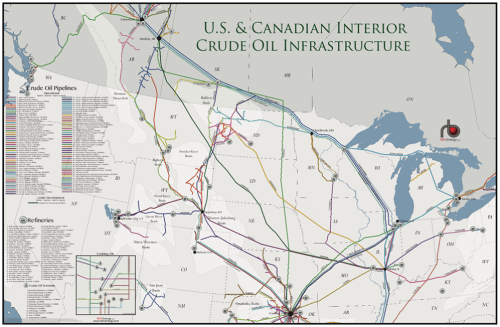
RBN's US & Canadian Interior Crude Oil Infrastructure Map features pipelines, refineries, and terminals that are new, existing, and under development from Canada to the Bakken Shale to Cushing.
In our April Fools’ Day recap of 2018 earnings titled Surprise, Surprise, we showed that the 2018 financial results of our universe of 44 major U.S. E&P companies provided strong evidence that belied investor doom and gloom about the industry. U.S. E&Ps successfully reworked their portfolios, reduced their costs and embraced a new emphasis on financial discipline that enabled a return to profitability levels near those they enjoyed in the $100+/bbl oil price environment in 2014. After a dramatic plunge from $57 billion in pre-tax operating profit in 2014 to $128 billion in losses in 2015 and $30 billion in losses in 2016, the industry clawed its way back to breakeven in 2017. Although average revenues rose just 20% between 2017 and 2018, the 44 E&Ps’ net profit jumped mightily to $11.26/barrel of oil equivalent (boe) in 2018, from just $0.07/boe earned in the previous year. The disproportionate increase in net profit was the result of significantly lower costs, including DD&A (depreciation, depletion and amortization) expenses, Impairments, and Exploration/Other expenses, which fell 8%, 59%, and 38% year-on-year, respectively. Underscoring the health of the industry — and nudged by U.S. corporate tax reform — the E&Ps repurchased nearly $16 billion in common shares in 2018, about 50% more than in 2014.
Although overall per-unit revenues were 10% lower in the first quarter of 2019 at $32.88/boe, compared with $36.65/boe in the fourth quarter of 2018, that solid performance in net profits continued in 2019. As seen in Figure 1, profitability in the first quarter of 2019 was higher than fourth quarter 2018 and on par with the first and second quarters of 2018. Our universe of 44 E&Ps earned $10.38/boe (blue bar segment to far right in Figure 1) in the first quarter of 2019. Fourth quarter profitability was depressed by $7.3 billion in impairment charges, which largely stemmed from M&A divestiture proceeds that were lower than the companies’ book values for the assets sold. In contrast, impairment charges were negligible in the first quarter of 2019, and other operating expenses (lifting costs, DD&A, Exploration/Other) were down 2% as producers continued to concentrate on operational efficiency. The reduction in revenues did decrease cash flows by $3.75/boe to $22.72/boe. Anticipating lower cash flows, the companies we track had budgeted an average 12% decrease in 2019 capital expenditures. Producers further adjusted by reducing share buybacks by 20% to $2.9 billion in the first quarter of 2019. The Diversified E&P Peer Group led the three peer groups in earnings by posting a profit of $12.69/boe — 13% better than the Oil-Weighted E&Ps and more than twice the per-boe profit of the Gas-Weighted E&Ps. Oil and gas production (gray line) slid by 1.2% in first quarter 2019 to 1.14 billion boe — the first decline in many years — on sharply lower output by the Gas-Weighted E&Ps.
About the song
"You Can't Keep a Good Man Down," was written by Barry, Robin, and Maurice Gibb, and appears as the 5th cut on side one of the Bee Gees 18th studio album, Children of the World. The album was recorded at Le Studio in Quebec and released in September 1976. The Bee Gees handled the production duties on the album. Children of the World yielded three Top 20 singles, including the #1 hit, "You Should Be Dancing." It went to #8 on the Billboard Top 200 Albums chart. Personnel on the record were: Barry Gibb (lead and backing vocals, rhythm guitar), Robin Gibb (lead and backing vocals) and Maurice Gibb (bass guitar, lead and backing vocals). Twelve additional support musicians were used in the recording of the LP.
The Bee Gees were a pop music group formed in 1958 by brothers Barry, Robin and Maurice Gibb. They have released 22 studio albums, two live albums, 15 compilation albums, one soundtrack album and 83 singles. They have sold over 220 million records worldwide. They have won 14 Grammy Awards and 109 BMI Awards, including a BMI Icon Award. They are members of the Rock and Roll Hall of Fame, Songwriters Hall of Fame and Vocal Group Hall of Fame. All three brothers (Maurice, posthumously) were invested as Commanders of the British Empire at a ceremony at Buckingham Palace in 2004. Barry Gibb was knighted by Prince Charles in 2008. Maurice Gibb passed away in 2003, and Robin Gibb in 2012. Barry Gibb continues to record as a solo artist to this date.