Over the past decade, the only significant growth market for U.S. crude oil and NGLs has been exports, with over 90% departing from the Gulf Coast. Exports via Gulf of Mexico ports have surged from about 1 MMb/d in 2016 to over 6 MMb/d last year. Great news for PADD 3 export facilities, right? Well, it’s not that simple. The distribution of barrels has been wildly uneven, resulting in significant winners, forlorn losers, and everything in between. And export volumes are still ramping up, as is the competition among marine terminals for crude and NGL export market share, with far-reaching consequences for producers, midstreamers and exporters. This is one of the core themes at our upcoming NACON conference, which is all about PADD 3 North American Crude Oil & NGLs and scheduled for October 24 at the Royal Sonesta Hotel in Houston. In today’s RBN blog, we’ll delve into the highly competitive liquids export landscape, consider some of the important factors driving flows one way or the other, and — fair warning — slip in some subliminal advertising for the NACON event.
It's a highly competitive market out there. For PADD 3 crude oil exports, Corpus Christi has dominated the scene for the past five years, but the Houston area is mounting a strong comeback. In fact, Houston could reclaim the lead if one of the deepwater offshore projects gets built. Today, Houston is out front in LPG exports, but Port Arthur/Nederland has been challenging this position — and Houston’s now fighting back with the announcement of a new Enterprise expansion on the Houston Ship Channel. For ethane, it sure looks like Port Arthur/Nederland is gaining the upper hand, with an Energy Transfer expansion and the new Enterprise Neches River flex facility in the works. Meanwhile, new greenfield proposals continue to be confidentially floated, potentially disrupting the market landscape.
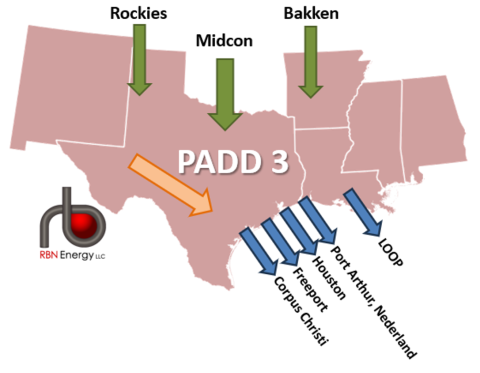
What’s fueling this beehive of competitive activity? To make sense of what’s going on, let's start at the beginning. What exactly do we mean by PADD 3 exports? As shown in the stylized and simplified Figure 1 graphic of our PADD 3 model, crude oil and Y-grade NGLs flow into the region from the Rockies, the Midcontinent and the Bakken (green arrows). These barrels merge with PADD 3 production, primarily from the Permian and Eagle Ford (orange arrow), before being transported to export markets. About 90% of the growth in U.S. liquids production over the past decade moves along these corridors and is exported from one of five port locations: Corpus Christi, Freeport, Houston, Port Arthur/Nederland, and LOOP (blue arrows). NGLs are exported from the Texas ports, while crude oil is shipped from all ports except Freeport. However, there is a significant disparity in the distribution of barrels among these ports. We’ll get back to the magnitude and reasons for the unequal allocation of export volumes in a minute.
Figure 1. PADD 3 Crude and NGL Inflows/Outflows. Source: RBN
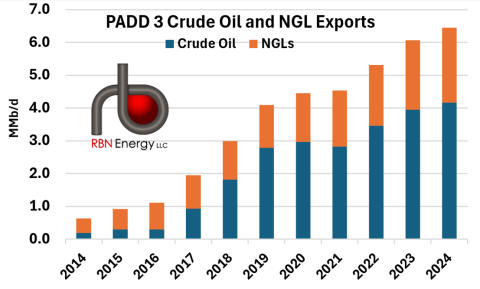
But before we get ahead of ourselves, let's look at the explosive growth in volume that’s driving this competitive landscape. PADD 3 production of crude and NGLs, which we collectively refer to as “liquids,” has surged over the past decade, increasing from 11.8 MMb/d in 2014 to 19.4 MMb/d year-to-date (YTD) in 2024. This rapid rise has catapulted the U.S. as a whole to nearly 20% of the International Energy Agency’s (IEA) global oil supply figure of 102.9 MMb/d, more than double Saudi Arabia’s share. (Note that the IEA’s global production numbers include both crude oil and NGLs.) The lion’s share of this incremental U.S. production is being channeled to export markets, with a whopping nine out of 10 export barrels now flowing through Gulf Coast ports, according to the EIA’s PADD 3 data. As shown in Figure 2 below, PADD 3 crude and NGL exports have soared from 650 Mb/d in 2014 to over 6.5 MMb/d YTD 2024 — an astounding compound annual growth rate (CAGR) of 25%.
Figure 2. PADD 3 Crude and NGL Exports. Source: EIA
What determines which ports and docks benefit from the torrent of barrels moving to export markets? There are many factors involved, but the three most important are:
- Connectivity: The routes between the sources of production and export locations. Export barrels require direct, reliable access to these points of shipment.
- Infrastructure: Dock infrastructure must include storage, ship loading equipment, ample dock space, and, for NGLs, sufficient chiller capacity to handle export volumes.
- Economics: The entire value chain, from production to shipping and finally to the end-destination market, must be economically favorable compared to other alternatives.
Let’s look at a few examples of how the interaction among these factors is playing out in today’s competitive marketplace.
Corpus vs. Houston Crude Exports
For the past five years, Corpus and Houston have been fiercely competing for the dominant share of Gulf Coast crude exports, primarily from barrels sourced from the Permian Basin. In 2019, Houston held a 37% market share, while Corpus had only 31%. However, the landscape shifted with the startup of three new pipelines — Plains Cactus II, EPIC Crude, and Gray Oak — that collectively added 1.9 MMb/d of connectivity between West Texas and Corpus. These pipelines, backed by take-or-pay shipper commitments, were half-full within a year and mostly full by 2023. Consequently, Corpus’s market share surged to 60%, while Houston’s dropped to 23%.
But Houston came back strong. Between 2020 and 2022, the Wink-to-Webster (W2W) and Midland-to-Echo III combo pipeline added 1.5 MMb/d of capacity from the Permian to the Houston area, providing a ready alternative when pipes to Corpus filled up. That has now happened. With Corpus pipelines maxed out, Houston has started reclaiming market share, rising to 30% this year, while Corpus has dropped to 52%. Although an expansion of the Gray Oak pipeline planned for next year will bring some barrels back to Corpus, it appears that most incremental Permian production will be directed to Houston for the foreseeable future, at least until those pipelines reach capacity as well.
Corpus vs. Port Arthur/Nederland NGL Exports
The situation for PADD 3 NGLs presents a stark contrast, with significant variations even within the NGL product complex. LPG exports — propane and normal butane — have long been dominated by Houston, where Enterprise and Targa were the sole players until 2015. That year, Energy Transfer’s Nederland facility came online, followed by Phillips 66’s Freeport docks in 2017. Despite these additions, in 2024 Houston still commands a 57% market share, with Energy Transfer Nederland and Phillips 66 Freeport holding 26% and 13%, respectively. The rest of the Gulf Coast accounts for only 4%.
A couple of infrastructure project announcements in 2023 by Enterprise and Energy Transfer for new Neches River/Nederland facilities planned for 2025 would bring on significant LPG competition for Houston. All the new Gulf Coast NGL chiller capacity — key infrastructure necessary to export LPGs on the big ships, VLGCs (Very Large Gas Carriers) — was being built in the Port Arthur/Nederland/Neches River region. But just as with crude oil, Houston fought back. Enterprise announced on its Q2 earnings call last week that more chiller capacity along with other export infrastructure will be built in Houston, enabling a 300-Mb/d LPG export capacity expansion on the Houston Ship Channel.
But that may not hurt the Port Arthur/Nederland/Neches River region as much as you might think. It now looks like Enterprise Neches River flex capacity that might have been deployed in LPG service will be used primarily for ethane exports. With both Energy Transfer and Enterprise focusing on ethane exports from the Neches port, it looks like that port area is poised to take the lead in the ethane sector.
Offshore SPM Docks vs. Everybody
The best illustration of full value chain economics in export markets is the ongoing push to develop one or more single-point mooring (SPM) offshore crude export terminals. No matter how you do the math to estimate total export capacity, these deepwater SPM facilities are NOT needed to enable more exports. We figure the Gulf Coast has about 7.1 MMb/d of crude oil export capacity, with average utilization this year to date coming in at 4.2 MMb/d. So, there’s more than enough capacity out there.
Instead, the real driver for an offshore SPM facility lies in the economics of transferring crude oil to a terminal capable of fully loading VLCCs (Very Large Crude Carriers). This reduces both the cost and time of loading and allows for greater utilization of these 2-MMbbl vessels, thereby lowering the overall shipping costs for U.S. crudes to global markets. Furthermore, if a major integrated player builds one of these terminals, the entire value chain — from point of production to the destination market — can be optimized, significantly enhancing export economics. That would shake up the crude oil export market all across the Gulf Coast — and the world, for that matter.
NACON – North American Crude Oil & NGLs: PADD 3
These are just three examples of how export competitive dynamics are reshaping crude oil and NGL markets. And in this blog, we’ve just scratched the surface. There’s a lot more going on, with oil production growth slowing, but NGL volumes still surging. New Permian NGL pipeline takeaway capacity is just around the corner, with Permian oil and NGLs both reaping the benefit of new natural gas pipeline takeaway. Permian gas processing capacity continues to ramp up too, and new Mont Belvieu fractionators keep on coming. On October 24, we’ll take a deep dive into these topics and many more at RBN NACON — North American Crude Oil & NGLs: PADD 3 — which will be held at the Royal Sonesta in Houston.
The one-day conference will be structured similarly to other industry conferences we’ve hosted in recent years, with RBN presentations interspersed with discussions with industry leaders. In six presentations distributed throughout the day, our analysts will do short, to-the-point presentations on different aspects of PADD 3 crude and NGL markets. We’ll cover our production outlook, our view of infrastructure developments necessary to get this production to export markets, and the demand for U.S. volumes. The whole RBN crew will be there, available for questions, sidebar conversations and general discussion about what we are hearing in the market.
But of course, RBN analytics can only take you so far. To fully understand what is going on, we need to hear from the industry leaders who are making it happen — folks who are focused on energy products, infrastructure and markets. We are excited to announce the participation of a group of industry leaders that effectively covers every aspect of U.S. exports:
Jim Teague, Co-CEO, Enterprise Products
Willie Chiang, CEO & Chairman of the Board, Plains All American
Rusty Braziel, Founder & Executive Chairman, RBN Energy
Kent Britton, CEO, Port of Corpus Christi
Brian Freed, CEO, EPIC Midstream
David Braziel, President and CEO, RBN Energy
Sean Maher, Chief Economist, Phillips 66
Kristen Holmquist, Managing Director, Analytics, RBN Energy
Robert Auers, Manager of Refined Fuels, RBN Refined Fuels Analytics
Collectively the companies led by these industry veterans touch export infrastructure across the board for oil and NGLs. And in addition to this auspicious group, we have invitations out to several more industry experts who will bring an even broader perspective to our conference.
Conference Details
NACON is scheduled for October 24, 2024, at the Royal Sonesta in Houston, TX. The registration fee is $950 per person.
REGISTER HERE
Discounts are available for groups of three or more. For more information on group rates, send an email to info@rbnenergy.com or call 281-377-6017.
“Are You Ready” was written by Angus and Malcolm Young and appears as the first song on side two of AC/DC’s 12th studio album, The Razors Edge. Released as a single in March 1991, it reached #16 on the Billboard Mainstream Rock Singles chart. The music video for the song, directed by David Mallet, shows AC/DC playing a concert in a prison, with the inmates dressed in white and wearing AC/DC hats. The song features a solo from Angus Young that may be the only one he has recorded using a tremolo bar dive. Personnel on the record were: Brian Johnson (lead vocals) Angus Young (lead guitar), Malcolm Young (rhythm guitar, backing vocals), Cliff Williams (bass, backing vocals), and Chris Slade (drums).
The Razors Edge was recorded in 1990 at Little Mountain Sound in Vancouver and produced by Bruce Fairbairn. It’s the only AC/DC album to feature Welsh drummer Chris Slade. AC/DC has never been known as a singles band, but this album produced three hit singles. Released in September 1990, it went to #2 on the Billboard 200 Albums chart and has been certified 6x Platinum by the Recording Industry Association of America. Four singles were released from the LP.
AC/DC is an Australian rock band formed in Sydney in 1973 by brothers Angus and Malcolm Young. To AC/DC fans, there is the Bon Scott era and the Brian Johnson era. Twenty-seven members have passed through the band since its formation. Angus Young is the only original member still in the band. For 51 years the sound and the power of AC/DC has never let up. They have released 18 studio albums, three live albums, two soundtrack albums, one EP and 57 singles and have sold more than 200 million records worldwide. They were inducted into the Rock and Roll Hall of Fame in March 2003. Bon Scott died in 1980, and Malcolm Young died in 2017. They continue to record and tour and are currently on their Power Up Tour in Europe. The personnel on the tour are: Brian Johnson (lead vocals), Angus Young (lead guitar), Stevie Young (rhythm guitar, backing vocals), Chris Chaney (bass, backing vocals), and Matt Laug (drums).


