Last week (Feb 19, 2013) we explored California’s cap-and-trade program for Greenhouse Gas emissions (GHG) and saw that it has already increased electricity prices by 20% and pushed up the cost of refining a barrel of oil by $0.78/bbl. These developments are just the tip of the iceberg. California’s program will impact regional natural gas demand and basis. Companies will shift the locations where crude oil is processed. Power imports into the California market from the Pacific Northwest will soar. Today we’ll dive even deeper into the emissions market to better understand the outlook for GHG pricing and how the cap-and-trade rules are likely to influence all sorts of energy and fuel markets.
Recap
On January 1st, 2013, California’s cap-and-trade program for GHG went live. It was the culmination of years of preparation, starting with California’s Global Warming Solutions Act of 2006 which directed the California Air Resources Board (CARB) to implement a cap-and-trade program that would reduce the state's greenhouse gas emissions (GHGs) to 1990 levels by the year 2020. In Part I of this series we described how the program works, reviewed some of the initial pricing for allowances and went through the math of GHG impact on power prices and crude oil refinery economics. This posting will make a lot more sense if you read Part I first. Suffice to say that it may be a convoluted market, but that doesn’t mean it won’t have a big influence on the value of energy commodities in the western United States. It will.
Who’s In Now – Who’s in Later?
As shown in Figure #1, CARB has estimated that during 2013 and 2014 emissions that are subject to the 160.4 million metric ton (MMT) cap total about 170 MMT, with 62% coming from the electricity sector (generators and importers), 22% from refining petroleum products, and 17% from stationary industrial emissions. That’s what is happening now.
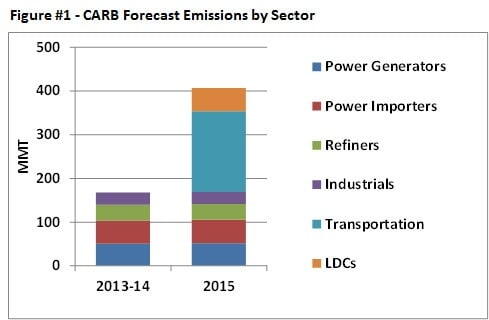
But in 2015 the program size more than doubles when transportation fuels and all natural gas deliveries are added. The total emissions subject to the cap jumps up to 407 MMT with 45% from the burning of transportation fuels, 26% from the electricity sector, 13% from residential/commercial natural gas (Local Distribution Companies, or LDCs), and the balance split between refining and stationary industrial. The cap itself increases to 377.7 MMT.
The economics for each of these market sectors is different, but the fundamentals all work the same way. The market sets the price of allowances based on the supply and demand for the allowances across all of the market sectors. That price theoretically reflects the cost (or opportunity cost) of curtailing emissions. Those companies with the lowest cost of curtailing emissions do so by making investments and those companies then sell their allowances to firms with a higher cost of curtailing emissions, allowing both parties to benefit from the trade. For most industries, the cost of reducing GHG is the cost associated with increases in energy-efficiency either through capital investments or process improvements. So for example, a cement manufacturer may invest in more efficient kiln which reduces its emissions. The cement manufacturer then sells its excess GHG allowances to a manufacturer of widgets, who would continue to emit greenhouse gasses. Each year the widget manufacturer would be required to buy more allowances as its annual cap is reduced.
How Much Will Allowances Cost?
We mentioned in Part I that CARB held its first auction for 2013 allowances in November 2012 when it sold 23 million metric tons (MMT) of allowances at a clearing price of $10.09 per allowance. That was slightly above a $10.00 floor price that CARB had set for the auction. Since then the bilateral market for Vintage 2013 allowances traded from $12 to $16 per ton, with recent trades coming in around the $14 per ton level.
Last Tuesday, February 19th, CARB held its second auction. The 2013 allowances cleared at $13.62 with bids of 31.9 MMT compared to supply offered by CARB of 12.9 MMT. There were approximately 16 MM in bids under $12.50. Almost 90% of the buyers were entities that have a compliance obligation. That is a reasonably strong price and above what much of the market was expecting. But it is still about $0.60 below what the bilateral market was trading just before the auction.
CARB also auctioned 2016 allowances. Demand was very light, with only 4.4 MMT of allowances purchased at the floor price of $10.71. 100% of the buyers were entities with a compliance obligation.
Emissions Forecast
Energy GPS (contributor Tim Belden’s firm) has developed a model for estimating GHG emissions on a forward basis for all energy sectors that are subject to the cap-and-trade program. Our 2013 Forecast is reflected in Figure #2 below.
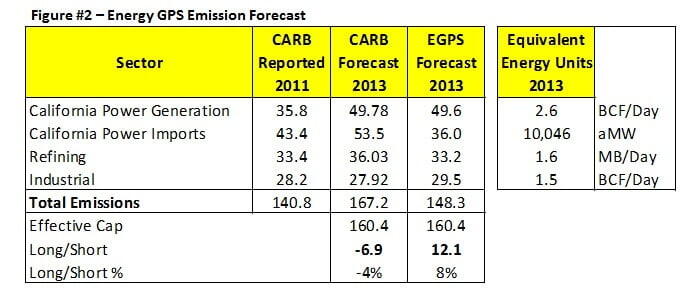
The first column in Figure #2 shows actual reported emissions for entities subject to the 2013 cap as published by CARB in January 2013 (note the long lag between when emissions occur and when reported by CARB). The next two columns show the CARB forecast for 2013 emissions developed in 2010 and then the most recent Energy GPS forecast for 2013 emissions.
We thought it would be helpful to put these numbers in a context more familiar to RBN members that work mostly in natural gas, NGL and crude oil markets. So that’s what we have in the column titled “Energy Equivalent Units 2013”. Specifically, the California Power Generation emissions equate to burning 2.6 BCF/day of natural gas, the California Power Imports are driven by 10,046 aMW (average megawatts, various fuel sources), the refining emissions are based on 1.6 million barrels per day of crude oil throughput, and the industrial emissions equate to 1.5 BCF per day of natural gas consumption (note that not all of the industrial emissions are from natural gas). Hopefully these conversions provide RBN members a better sense of the scale of the fuel that is covered by the cap-and-trade program.
So what do the numbers in Figure #2 tell us? Let’s first look at the California Power Generation category; comparing the Energy GPS 2013 forecast to the CARB Reported 2011 values. It might be somewhat surprising that 2011 emissions are actually lower than our 2013 forecast. But there are good reasons for it.
First, 2011 was a very good “water year” in California, which meant lots of hydroelectric power. In contrast, this year we expect about 1,400 MW less hydro production than 2011. Second, California nuclear power generators have been on the fritz, resulting in the loss of 2,400 MW of power production. The implication is a reduction in carbon-free power production of 3,800 MW which has been replaced with natural gas-fired generation. Those two factors account for most of the difference between 2011 reported emissions and the 2013 Energy GPS Forecast.
Now let’s turn our attention to California Power Imports. There is a complex set of rules around accounting for emissions associated with imported power. Both the 2011 reported emissions and the 2013 CARB Forecast emissions do not reflect the current rules associated with imports. Based on the current rules, Energy GPS built a bottom-up model to estimate power imports and associated emissions by region. The bottom line is that the rules as they stand now will result in a lot of carbon-free power from the Pacific Northwest being imported into California. A whole lot. We’ll examine this phenomenon in more detail below.
Note that CARB numbers indicate the market is “short” emission credits by 4%, but in contrast, our analysis indicates the market is “long” by 8%. This means that it is our view that there are more emissions allowances than are needed by the market participants covered by the program. We see the trend continuing through 2014 and 2015 when the transportation fuels and residential/commercial natural gas are added to the program. That said, there are some important sources of variability that can change this outcome dramatically. One of the largest sources of variability is California hydroelectric (“hydro”) production. The spread between the lowest and highest annual hydro production between 2001 and 2012 adds up to 9.4 MMT of emissions variability. That’s a big swing.
Also, if our estimate of emissions associated with imported power is wrong, it could increase emissions by 4 MMT in 2013.
And finally there is weather – the emissions related to the power sector that are weather sensitive have a standard deviation in the neighborhood of 3.0 MMT per year. That’s another potential source for big swings. While it is unlikely that California will flip to being “short carbon” in the next couple of years, it is possible. A cold, dry winter followed by a hot summer would certainly make things interesting. All of that means that the price of allowances could see some big swings in the coming months and years.
Energy Market Consequences
The impact of potential volatility in the price for allowances extends far beyond the bilateral and auction markets for allowances. We saw in Part 1 how the program has already increased electricity prices by 20% and pushed up the cost of refining a barrel of oil by $0.78/bbl.
What about natural gas prices and regional price differentials? There are some big changes coming, resulting from the impact of those power import rules we mentioned above. Here’s how it works. Under the rules, power importers have the option to designate the source for the power that they import. When they do, the power is assigned a carbon impact factor based on that source. The carbon impact factor of hydro power is zero. So as you might imagine, marketers are scouring the Pacific Northwest countryside, trying to secure purchase contracts for hydro power sources. That power will be imported into California at a zero carbon impact factor, benefiting from the now-higher power prices (20% higher due to carbon) without having to bear the cost of buying any allowances (due to the zero carbon factor). This will displace power that would have otherwise been generated within California using natural gas (its marginal source of generation), freeing up emission allowances So while the loss of the nuclear units and decline in hydro production has pushed up demand for natural gas in California (relative to 2011), the increase in imports caused by the cap-and-trade regulations will somewhat offset that change.
But wait just a minute. Demand for power in the Pacific Northwest didn’t decrease. The importer just took their hydropower and re-directed it south. What do you think replaces that power that was moved to California? You bet. The marginal source of power in the Pacific Northwest. Natural gas. Ah, the law of unintended consequences. The gas still gets burned. Just a few hundred miles to the north of California. You gotta love that state.
How about refineries? As we showed in Part 1, the higher the price of allowances, the higher the extra cost a California refiner will pay. It will pay that cost either as the cost of an allowance it has to buy, an opportunity cost (an allowance not sold) or an investment in hardware to reduce its allowances. Regardless of the form of the cost, the economic result is the same. More cost for the already high-cost California refining system. Clearly it makes no sense to refine a barrel of crude oil in California for the sale of products in any other market besides California. We’ll be watching to see what cap-and-trade means for California’s product prices, imports from other regions, and refinery runs.
As we have seen so many times in the past, when regulations attempt to designate some energy commodities different from others, especially when those commodities are fungible, it creates the opportunity for market distortions. Only time will tell how much distortion we’ll see from California’s cap-and-trade program. But it is clear that the impact on California’s energy markets will be profound. And that means all markets in North America need to pay close attention.
Avast, me hearties. We’ll continue to keep you posted on the voyages of Cap'n Trade.