The summer movie season opened with the latest — and reportedly last — entry in the Tom Cruise-propelled “Mission: Impossible” franchise called “The Final Reckoning.” That title reminded us that, to E&P executives, the commodity price crash at the onset of the pandemic in 2020 must have seemed like the final blow in a series of financial crises that brought many of their companies to the verge of bankruptcy. But in a dramatic, “Mission: Impossible”-style recovery, producers restored their battered balance sheets and won back investors by radically shifting cash allocations. In today’s RBN blog, we’ll review the rise of the new E&P hero — dividends — and analyze how producers apportioned cash flows in Q1 2025.
A hair-raising 90% erosion in U.S. E&P share prices between 2014 and 2020, as measured by the S&P E&P index, resulted largely from individual investors fleeing the oil and gas sector. Money had surged to the sector on the promise of substantial long-term growth with the Shale Revolution and the surge in crude oil prices to over $100/bbl in 2014. But a long, subsequent decline in realizations and massive overinvestment led to growing debt, massive losses and shrinking market caps. With E&Ps paying paltry dividends — just over 1%, on average, in 2019 compared with 4.6% for the integrated majors and 5.45% for midstream companies — oil and gas producers were the worst performing S&P group in five of seven years between 2014 and 2020.
No wonder E&Ps pivoted from their failed growth-at-all-costs strategy to target individuals and institutions who prioritized return on investment. Producers prioritized boosting cash flows over capital investment to wield a powerful tool to grow share prices: substantially higher dividends. With a big assist from the post-pandemic surge in oil prices, the average E&P dividend across the entire sector more than tripled to 3.28% in 2022 and 3.98% in 2023, with several major producers adding special dividends that brought total yields to near or even above 10%. These yields, which exceeded payouts by integrated majors like ExxonMobil and Chevron, resulted in the E&P sector becoming the top-performing S&P group in both years.
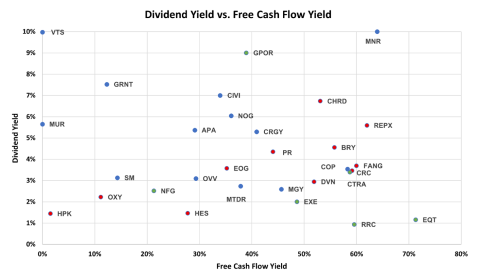
Although oil prices have slipped from their 2022-23 highs, the 39 large E&P companies we follow have managed to largely sustain their higher-than-historical dividend payouts that restored investor support. Figure 1 below shows the Q1 2025 yields (y axis) for the 28 of these companies that pay dividends (colored dots with stock symbols) compared with each company’s free cash flow yield (x axis). (For a list of stock symbols and company names, click here. Red dots are for companies in the Oil-Weighted group, blue dots are for the Diversified group, and green dots are for the Gas-Weighted group.) The free cash flow yield is the percentage of cash flow retained by an E&P after funding its capital investment program. The median free cash flow is 40% and the median dividend yield is 3.65%, still an elevated return on a historical basis. The median free cash flow return in the most recent quarter was up slightly from an average 37% in 2023.
Figure 1. E&Ps’ Free Cash Flow Yield vs. Dividend Yield, Q1 2025.
Source: Oil & Gas Financial Analytics, LLC
Join Backstage Pass to Read Full Article


