U.S. natural gas production in recent days has plunged more than 3 Bcf/d. While some Gulf of Mexico offshore and Gulf Coast production is still offline from the recent tropical storms, the bulk of these declines are happening in the Northeast, where gas production has dived 2 Bcf/d in the past week or so to about 30.2 Bcf/d, the lowest level since May 2019, pipeline flow data shows. Appalachia’s gas output was already down earlier in the month, as EQT Corp. shut in some volumes starting September 1. But with storage inventories soaring near five-year highs, a combination of maintenance events and demand constraints are forcing further curtailments of Marcellus/Utica volumes near-term. Today, we provide an update of Appalachia gas supply trends using daily gas pipeline flow data.
As we discussed on Wednesday in Part 3 of this blog series, the Northeast gas market has been volatile lately. Appalachian supply prices in the spot market earlier this week fell to three-year lows, despite production shut-ins being in effect. A confluence of factors influenced the downturn, including low weather-driven demand, pipeline outages that are restricting outflows, and the start of an annual fall maintenance event at Dominion Energy’s Cove Point LNG facility that took another 700 MMcf/d or so of export demand out of the market. What’s making all of that worse is that storage levels are soaring, not just in the Northeast but also in downstream markets, reducing flexibility to navigate supply congestion and forcing production curtailments. In the past couple of days, cash prices have strengthened again as production has pulled back.

Canadian crude output is rising, requiring new export routes. As traditional pathways face constraints, the U.S. Rockies—especially the Guernsey, WY hub—are emerging as key corridors for moving Canadian heavy crude to downstream markets, including the Gulf Coast.
We’re going to delve into the specifics of the latest production pullback using daily pipeline flow data from our good friends at Genscape next. Before we get into the production trends, though, let’s first review a bit about the data itself. The pipeline flow dataset comprises the daily gas volumes nominated by market participants to either be received or delivered at thousands of individual meters along natural gas interstate pipelines across the U.S. The meter volumes are then aggregated by type of connecting facility (i.e., gathering systems and processing plants that represent production, and power plants, industrial plants or distribution companies that represent demand); these pipeline flows provide critical insights into supply and demand trends on a daily basis. How much of the market flow this data captures can vary widely by region, but in the Northeast, it provides a high degree (~95%) of transparency into the region’s supply and demand picture. However, note that initial volumes for the most recent gas day can get revised based on final nominations reported for that day. The data discussed in today’s blog is as of the evening cycle for gas day Thursday, September 24. (See Sooner or Later and One Step Closer for more on flow data. We’ll also be demonstrating how to use flow data to track the Northeast gas market in our upcoming School of Energy Virtual on October 20-21, 2020.)
About the song
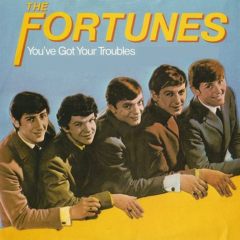
"You've Got Your Troubles" was written by Roger Greenaway and Roger Cook. It appears as the first song on side one of The Fortunes’ debut album, The Fortunes. Greenaway and Cook said they wrote the song in about two hours. Released as a single in August 1965, the song went to #7 on the Billboard Hot 100 Singles chart. Les Reed, who arranged the song, hired session musicians, with The Fortunes doing the vocals. Reed also arranged the trumpet and horn parts on the record. Noel Walker produced the song. There has been a bevy of other artists who have covered "You've Got Your Troubles" over the years. Personnel on the record were: Rod Allen (lead vocals), Glen Dale (backing vocals), and Barry Pritchard (backing vocals), supported by unlisted session players.
The Fortunes were an English pop band formed in Birmingham, England, in 1961. Original members in the band were: Rod Allen (lead vocals, bass), Barry Pritchard (backing vocals, lead guitar), Glen Dale (backing vocals, rhythm guitar), Andy Brown (drums), and David Carr (keyboards). Twenty different members have passed through the band since their formation. The Fortunes released 10 studio albums, one live album, and 25 singles. Rod Allen died in 2008, Barry Pritchard in 1999, Glen Dale in 2019, and David Carr in 2011. A four-piece group with no original members still tours as The Fortunes.